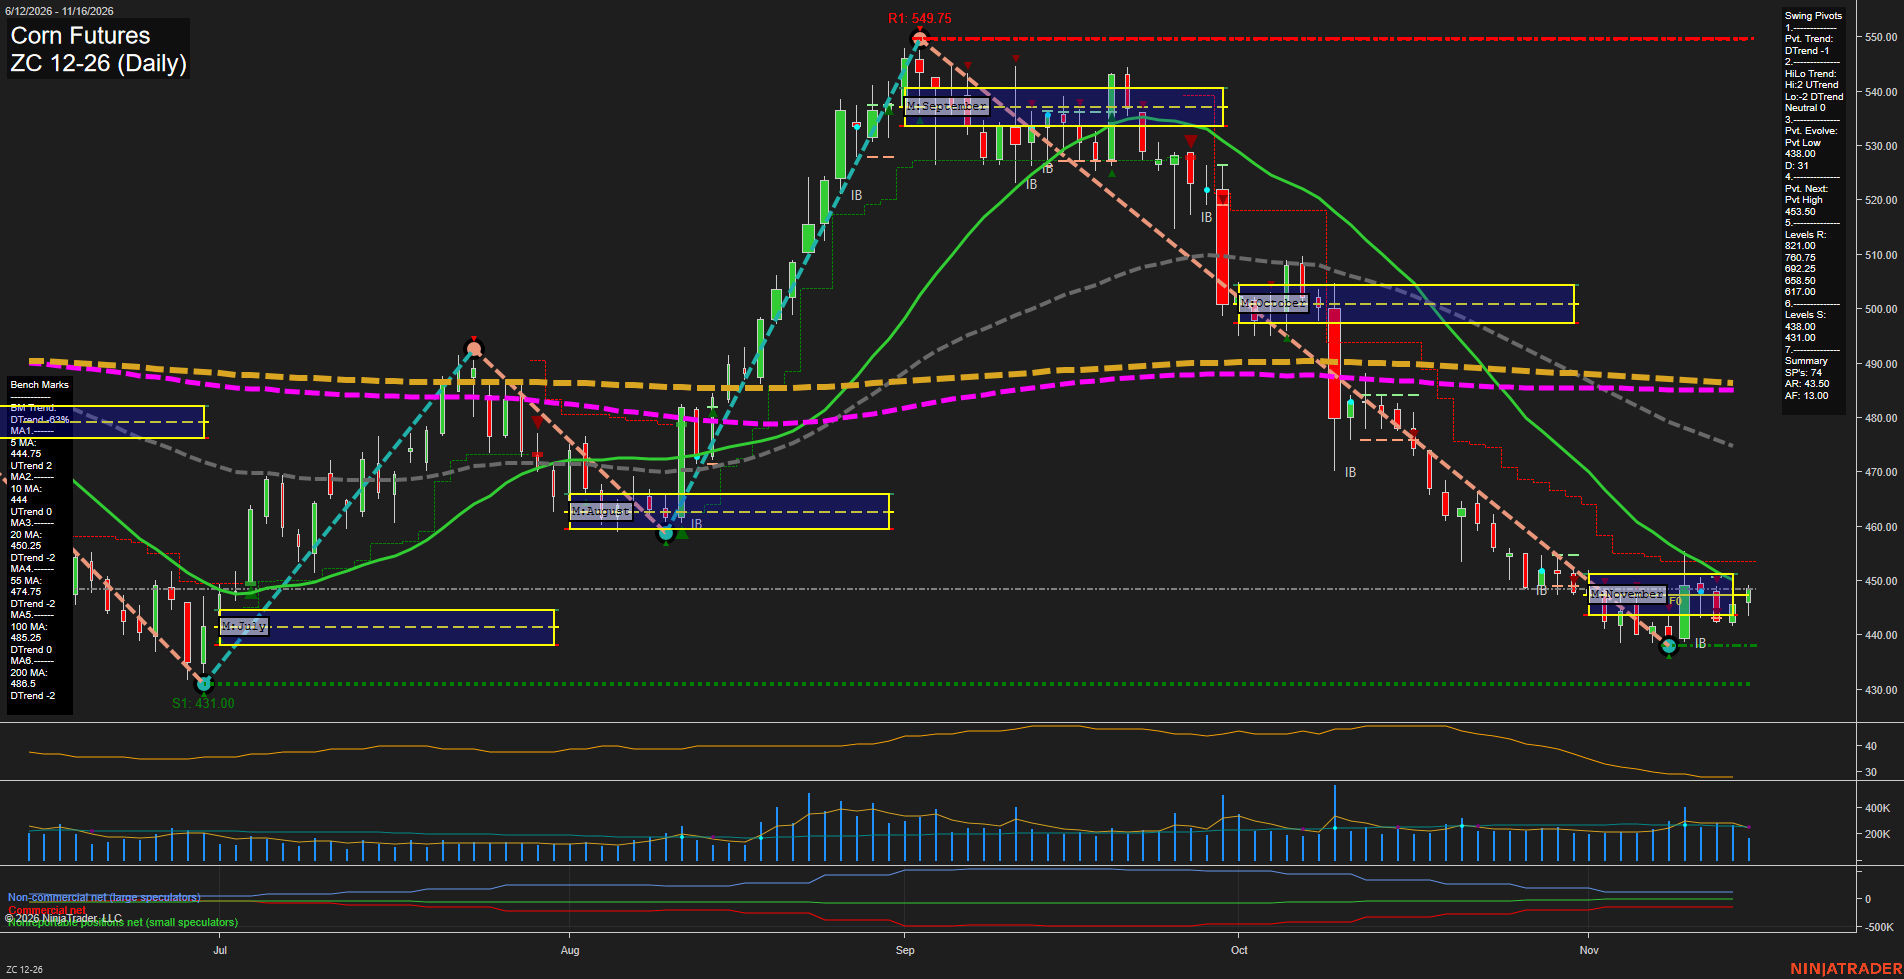
ZC Corn Futures Daily Chart Analysis — After Market Close: 2026-Nov-16 15:16 CT
Price Action
- Last: 448.50 approximately,
- Bars: Small,
- Mom: Momentum slow.
WSFG Weekly
- Near-Term
- WSFG Current: 17%
- F0%/NTZ' Bias: Price Above,
- WSFG Trend: Up.
MSFG Month Nov
- Medium-Term
- MSFG Current: 2%
- F0%/NTZ' Bias: Price Above,
- MSFG Trend: Up.
YSFG Year 2026
- Far-Term
- YSFG Current: -36%
- F0%/NTZ' Bias: Price Below,
- YSFG Trend: Down.
Swing Pivots
- (Near-Term) 1. Pvt. Trend: DTrend,
- (Medium-Term) 2. HiLo Trend: Neutral,
- 3. Pvt. Evolve: Pvt low 438.00,
- 4. Pvt. Next: Pvt high 453.50,
- 5. Levels R: 821.00, 700.75, 692.25, 658.50, 617.00,
- 6. Levels S: 438.00, 431.00.
Daily Benchmarks
- (Near-Term) 5 Day: 444.75 Up Trend,
- (Near-Term) 10 Day: 444.00 Up Trend,
- (Medium-Term) 20 Day: 450.25 Down Trend,
- (Medium-Term) 55 Day: 474.75 Down Trend,
- (Far-Term) 100 Day: 485.25 Down Trend,
- (Far-Term) 200 Day: 486.50 Down Trend.
Additional Metrics
Recent Trade Signals
- 16 Nov 2026: Long ZC 12-26 @ 448.5 Signals.USAR-WSFG
- 10 Nov 2026: Short ZC 12-26 @ 440.75 Signals.USAR-MSFG
Overall Rating
- Near-Term: Bullish,
- Medium-Term: Bearish,
- Far-Term: Bearish.
Key Insights Summary
The near-term picture is a modest countertrend recovery within the larger September–November decline. Price is above the rising 5-day and 10-day benchmarks, and the weekly grid and latest weekly signal favor the rebound. However, small candles and declining ATR indicate subdued momentum rather than an established upside acceleration. The pivot trend remains down, with an evolving low at 438.00 and a next-pivot reversal reference at 453.50. The falling 20-day benchmark at 450.25 is an immediate overhead reference, while 438.00 and 431.00 define the reported support levels. Medium-term evidence remains predominantly bearish despite the positive monthly grid, with price below both medium-term benchmarks and the latest monthly signal still short. Far-term weakness is consistent across the yearly grid and declining 100-day and 200-day benchmarks. The summary-reported resistance levels are distant historical references, not nearby breakout thresholds. The chart alone does not establish a news or seasonal catalyst for the current stabilization.
Chart Analysis ATS AI Generated: 2026-11-16 15:17 for Informational use only, not trading advice. Terms and Risk Disclosure Copyright © 2026. Algo Trading Systems LLC.