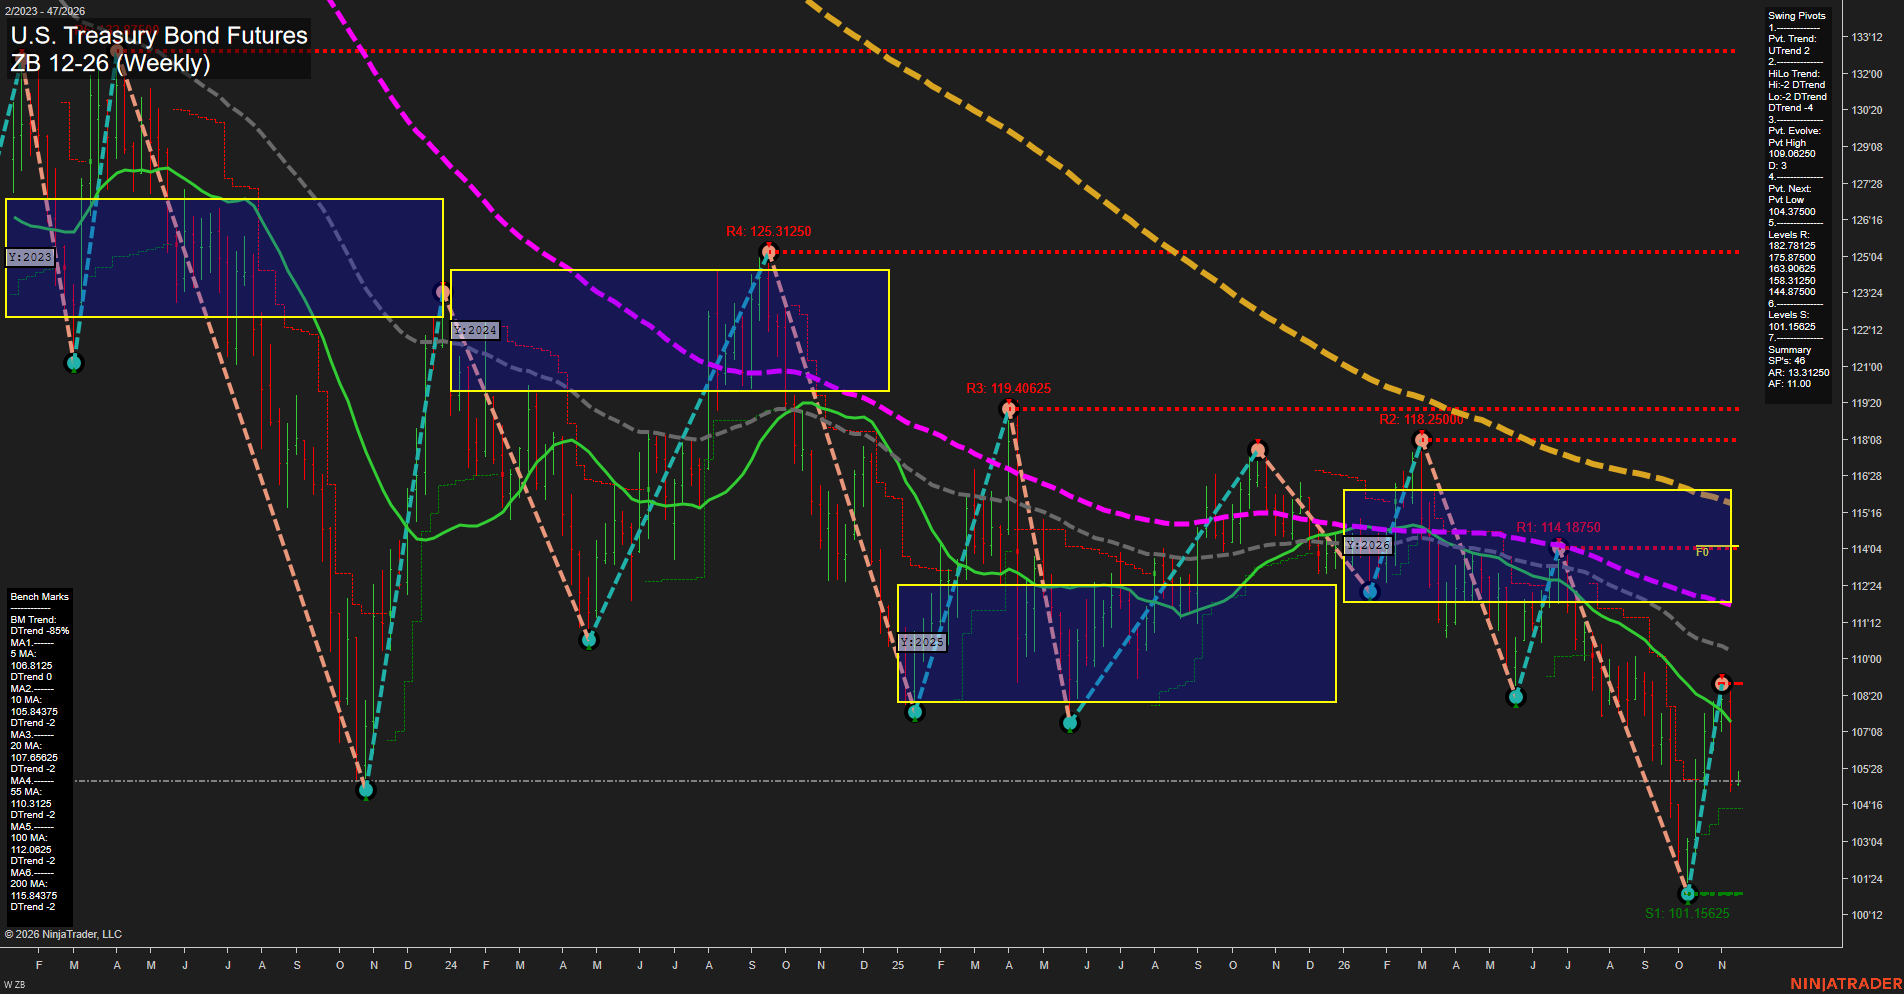
ZB U.S. Treasury Bond Futures Weekly Chart Analysis — After Market Close: 2026-Nov-16 15:16 CT
Price Action
- Last: Approximately 105.3; black price marker not visible,
- Bars: Large,
- Mom: Fast downside momentum following the recent rebound.
WSFG Weekly
- Near-Term
- WSFG Current: 5%
- F0%/NTZ' Bias: Price Above,
- WSFG Trend: Up.
MSFG Month Nov
- Medium-Term
- MSFG Current: -45%
- F0%/NTZ' Bias: Price Below,
- MSFG Trend: Down.
YSFG Year 2026
- Far-Term
- YSFG Current: -42%
- F0%/NTZ' Bias: Price Below,
- YSFG Trend: Down.
Swing Pivots
- (Near-Term) 1. Pvt. Trend: UTrend,
- (Medium-Term) 2. HiLo Trend: DTrend,
- 3. Pvt. Evolve: Pvt high 109.06250,
- 4. Pvt. Next: Pvt low 104.37500,
- 5. Levels R: 182.78125, 175.87500, 163.90625, 158.31250, 144.87500,
- 6. Levels S: 101.15625.
Weekly Benchmarks
- (Near-Term) 5 Week: 106.8125 Down Trend,
- (Near-Term) 10 Week: 105.84375 Down Trend,
- (Medium-Term) 20 Week: 107.65625 Down Trend,
- (Medium-Term) 55 Week: 110.3125 Down Trend,
- (Far-Term) 100 Week: 112.0625 Down Trend,
- (Far-Term) 200 Week: 115.34375 Down Trend.
Overall Rating
- Near-Term: Neutral,
- Medium-Term: Bearish,
- Far-Term: Bearish.
Key Insights Summary
From a futures swing-trading perspective, the rebound from 101.15625 to 109.06250 remains a countertrend recovery within a broader declining structure. The latest downswing has returned price beneath all six falling benchmarks, weakening the rebound despite the still-up near-term pivot classification and supplied bullish weekly grid. That conflict produces a mixed near-term assessment rather than a confirmed bullish reversal. Medium- and far-term conditions remain bearish, with lower swing highs, a declining HiLo trend, and price below the monthly and yearly grids. The pivot summary identifies 104.37500 as the next downside reversal threshold; 101.15625 remains the principal listed support. The summary’s resistance list differs from the nearby plotted resistance labels at 114.18750, 118.25000, 119.40625, and 125.31250; the resistance section above reproduces the requested summary values. The four named recent signal indicators are not readable in this image, and the supplied grid percentages cannot be independently verified from the visible chart. No news or seasonal catalyst is established by the image.
Chart Analysis ATS AI Generated: 2026-11-16 15:16 for Informational use only, not trading advice. Terms and Risk Disclosure Copyright © 2026. Algo Trading Systems LLC.