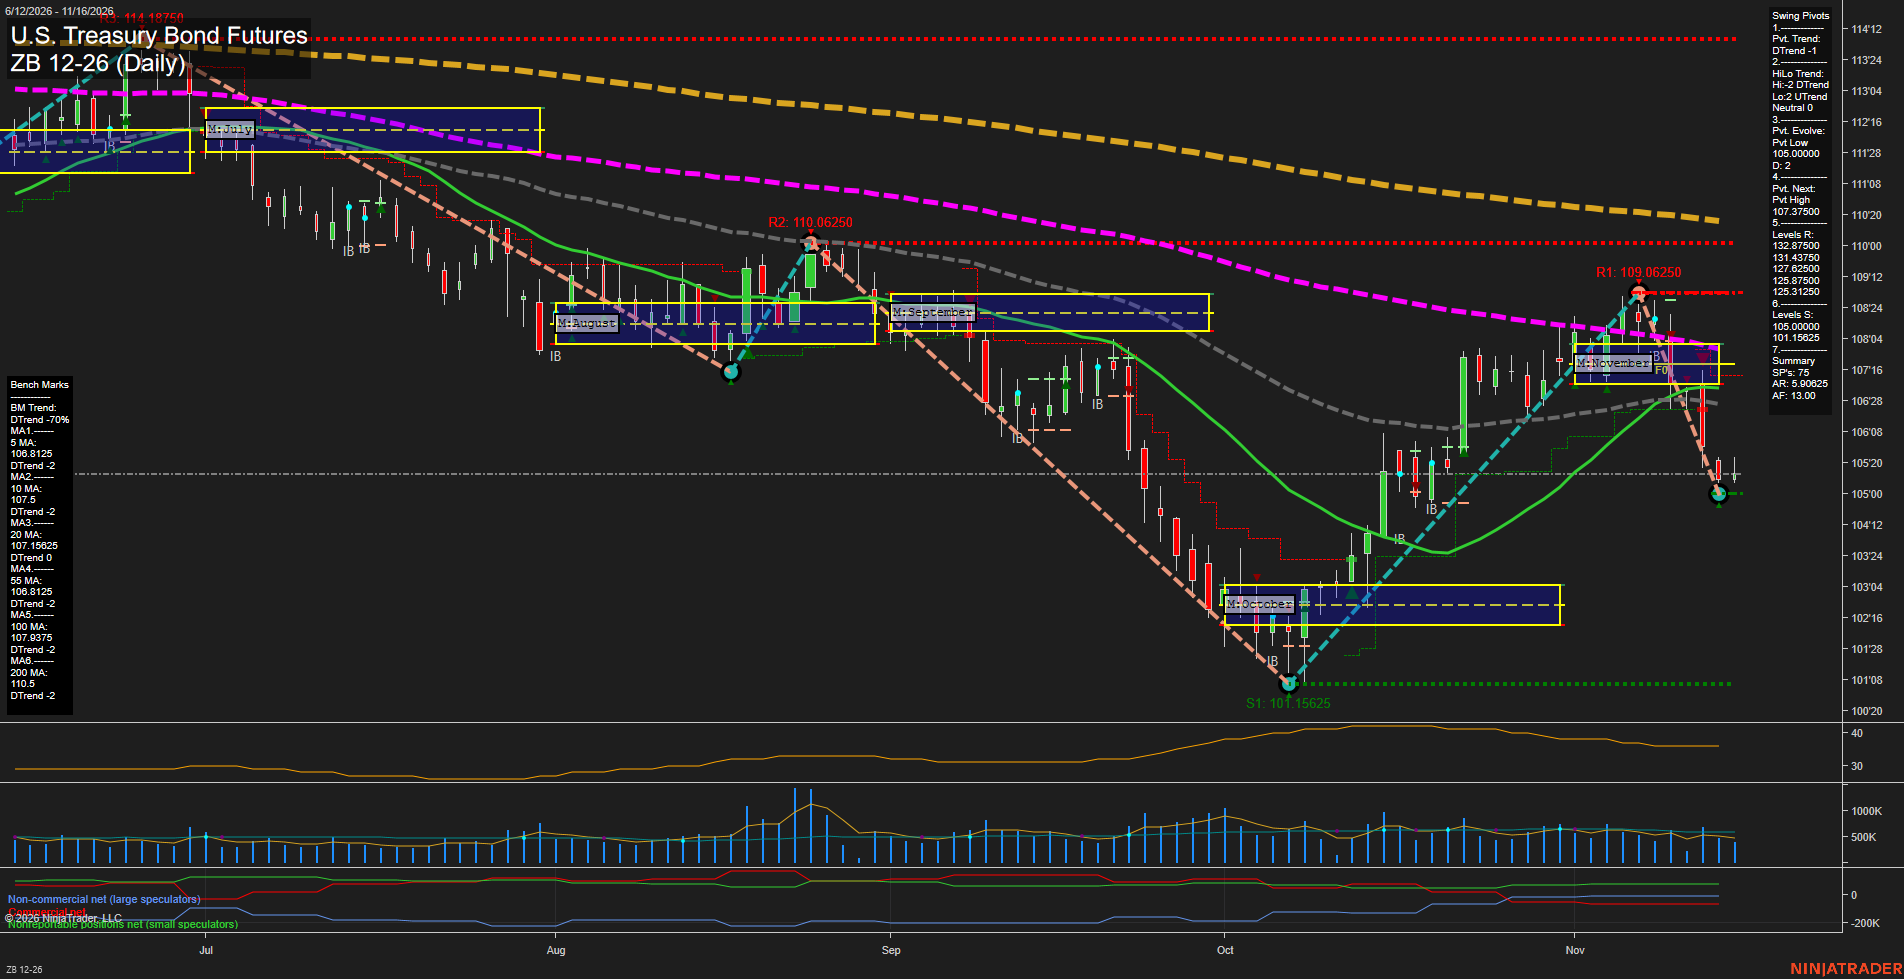
ZB U.S. Treasury Bond Futures Daily Chart Analysis — After Market Close: 2026-Nov-16 15:16 CT
Price Action
- Last: Approximately 105.3125,
- Bars: Small,
- Mom: Momentum slow.
WSFG Weekly
- Near-Term
- WSFG Current: 5%
- F0%/NTZ' Bias: Price Above,
- WSFG Trend: Up.
MSFG Month Nov
- Medium-Term
- MSFG Current: -45%
- F0%/NTZ' Bias: Price Below,
- MSFG Trend: Down.
YSFG Year 2026
- Far-Term
- YSFG Current: -42%
- F0%/NTZ' Bias: Price Below,
- YSFG Trend: Down.
Swing Pivots
- (Near-Term) 1. Pvt. Trend: DTrend,
- (Medium-Term) 2. HiLo Trend: Neutral,
- 3. Pvt. Evolve: Pvt low 105.00000,
- 4. Pvt. Next: Pvt high 107.37500,
- 5. Levels R: 132.87500, 131.43750, 127.62500, 125.87500, 125.31250,
- 6. Levels S: 105.00000, 101.15625.
Daily Benchmarks
- (Near-Term) 5 Day: 106.8125 Down Trend,
- (Near-Term) 10 Day: 107.5 Down Trend,
- (Medium-Term) 20 Day: 107.15625 Down Trend,
- (Medium-Term) 55 Day: 106.8125 Down Trend,
- (Far-Term) 100 Day: 107.9375 Down Trend,
- (Far-Term) 200 Day: 110.5 Down Trend.
Additional Metrics
Overall Rating
- Near-Term: Bearish,
- Medium-Term: Bearish,
- Far-Term: Bearish.
Key Insights Summary
The October recovery from 101.15625 to November's 109.06250 swing high has given way to a sharp retracement toward 105.00000. Small latest bars suggest slowing immediate downside momentum, but price remains below every benchmark average. The positive weekly grid is a countertrend feature rather than confirmation of a broader reversal. The pivot summary combines falling highs with rising lows, producing a neutral medium-term HiLo structure within otherwise bearish technical conditions. Nearby plotted resistance is 109.06250 and 110.06250; the resistance values listed above reproduce the summary's more distant historical levels. Support is defined at 105.00000, followed by 101.15625. The next opposite-pivot threshold is 107.37500. Recent named signal readings and news catalysts are not visible, so neither their direction nor a news-driven explanation can be established from this chart.
Chart Analysis ATS AI Generated: 2026-11-16 15:16 for Informational use only, not trading advice. Terms and Risk Disclosure Copyright © 2026. Algo Trading Systems LLC.