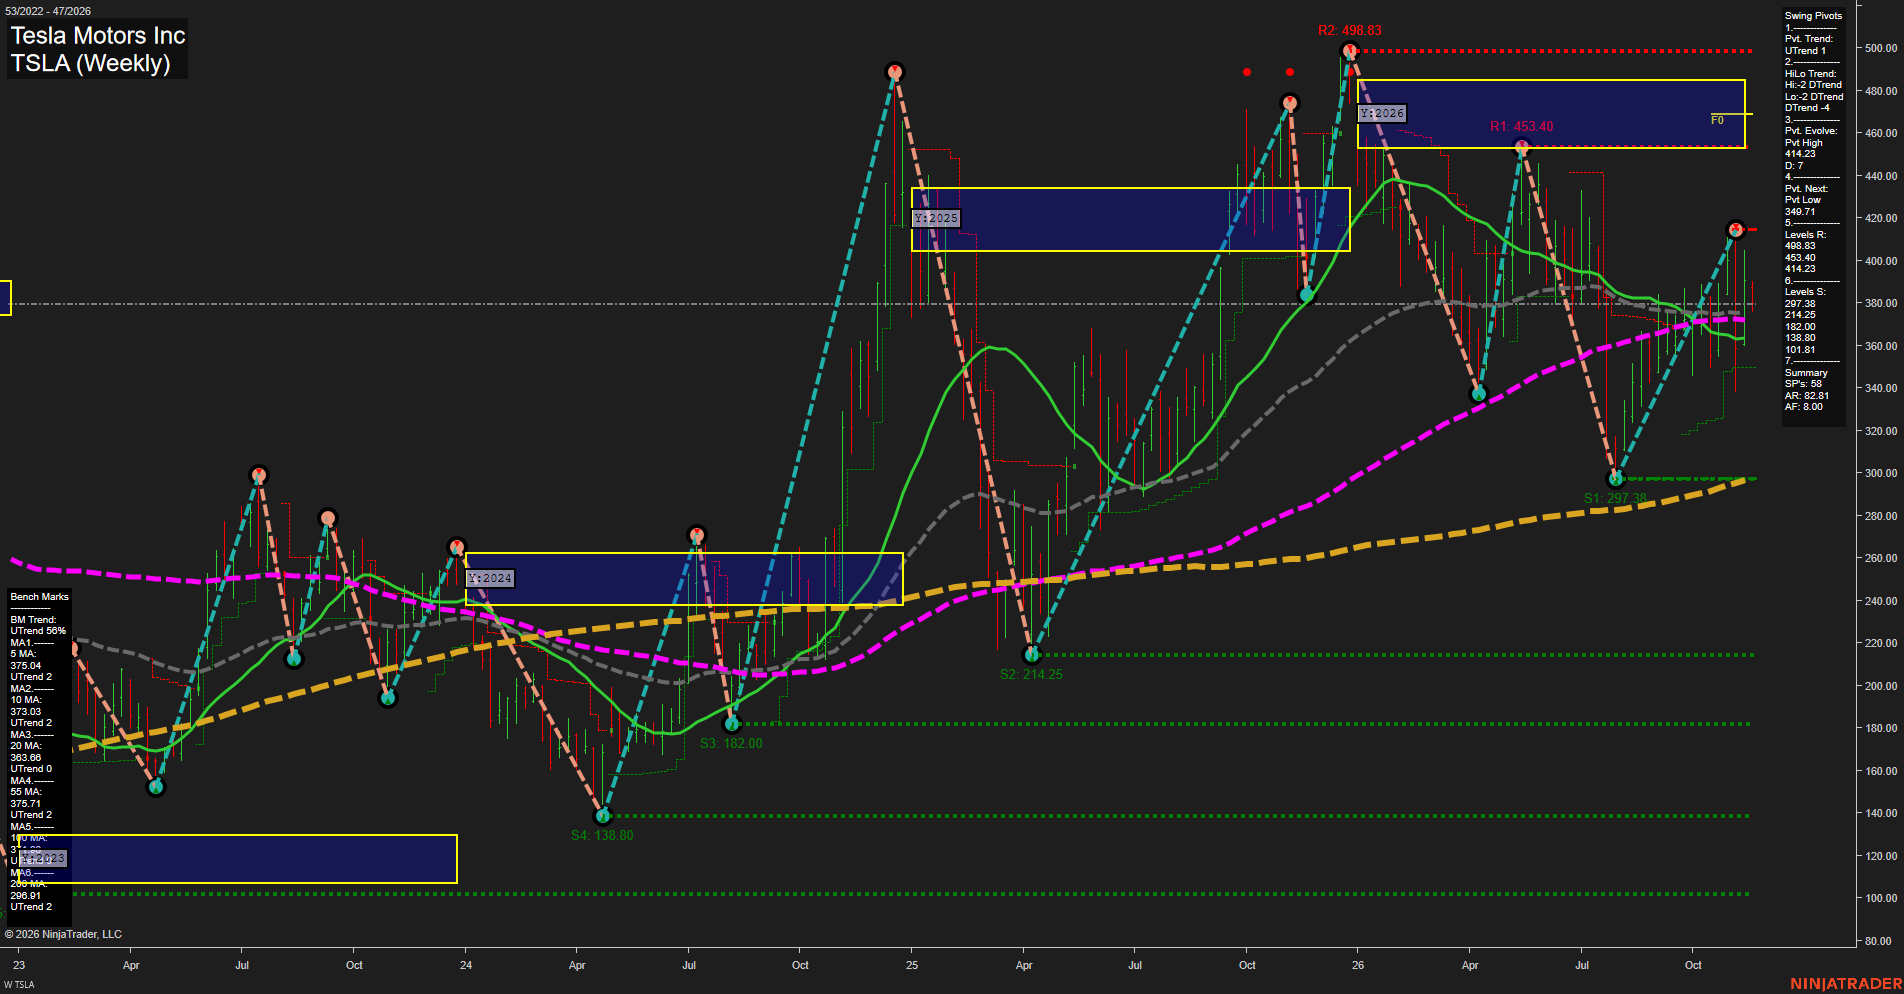
TSLA Tesla Motors Inc Weekly Chart Analysis — After Market Close: 2026-Nov-16 15:14 CT
Price Action
- Last: Approximately 379,
- Bars: Large,
- Mom: Momentum average.
WSFG Weekly
- Near-Term
- WSFG Current: NA%
- F0%/NTZ' Bias: Price Neutral,
- WSFG Trend: Neutral.
MSFG Month Nov
- Medium-Term
- MSFG Current: NA%
- F0%/NTZ' Bias: Price Neutral,
- MSFG Trend: Neutral.
YSFG Year 2026
- Far-Term
- YSFG Current: NA%
- F0%/NTZ' Bias: Price Neutral,
- YSFG Trend: Neutral.
Swing Pivots
- (Near-Term) 1. Pvt. Trend: UTrend,
- (Medium-Term) 2. HiLo Trend: DTrend,
- 3. Pvt. Evolve: Pvt high 414.23,
- 4. Pvt. Next: Pvt low 349.71,
- 5. Levels R: 498.83, 453.40, 414.23,
- 6. Levels S: 297.38, 214.25, 182.00, 138.80, 101.81.
Weekly Benchmarks
- (Near-Term) 5 Week: 375.04 Up Trend,
- (Near-Term) 10 Week: 373.03 Up Trend,
- (Medium-Term) 20 Week: 363.66 Up Trend,
- (Medium-Term) 55 Week: 375.71 Up Trend,
- (Far-Term) 100 Week: Approximately 372 Up Trend,
- (Far-Term) 200 Week: 298.01 Up Trend.
Overall Rating
- Near-Term: Bullish,
- Medium-Term: Neutral,
- Far-Term: Bullish.
Key Insights Summary
From a futures swing trader’s perspective, this equity chart shows a near-term recovery within a broader corrective structure, rather than a confirmed medium-term breakout. The pivot uptrend and rising benchmarks support the recovery from 297.38, but the medium-term sequence still contains lower highs and lower lows. Price is clustered around the 5-, 10-, 55- and 100-week benchmarks, reflecting congestion and two-sided weekly volatility. The evolving 414.23 high remains below resistance at 453.40 and 498.83; 349.71 is the next opposite-pivot reversal threshold, distinct from established support at 297.38. Rising long-term averages support the far-term bullish rating, although price remains below the visible 2026 annual NTZ, approximately 453–485, and its F0 reference near 469. The neutral grid entries above are placeholders, not confirmation of a neutral annual price position. Weekly and monthly grids and the specified recent trade signals are not displayed, so those signals cannot be verified. News and seasonal drivers are likewise not established by this chart.
Chart Analysis ATS AI Generated: 2026-11-16 15:15 for Informational use only, not trading advice. Terms and Risk Disclosure Copyright © 2026. Algo Trading Systems LLC.