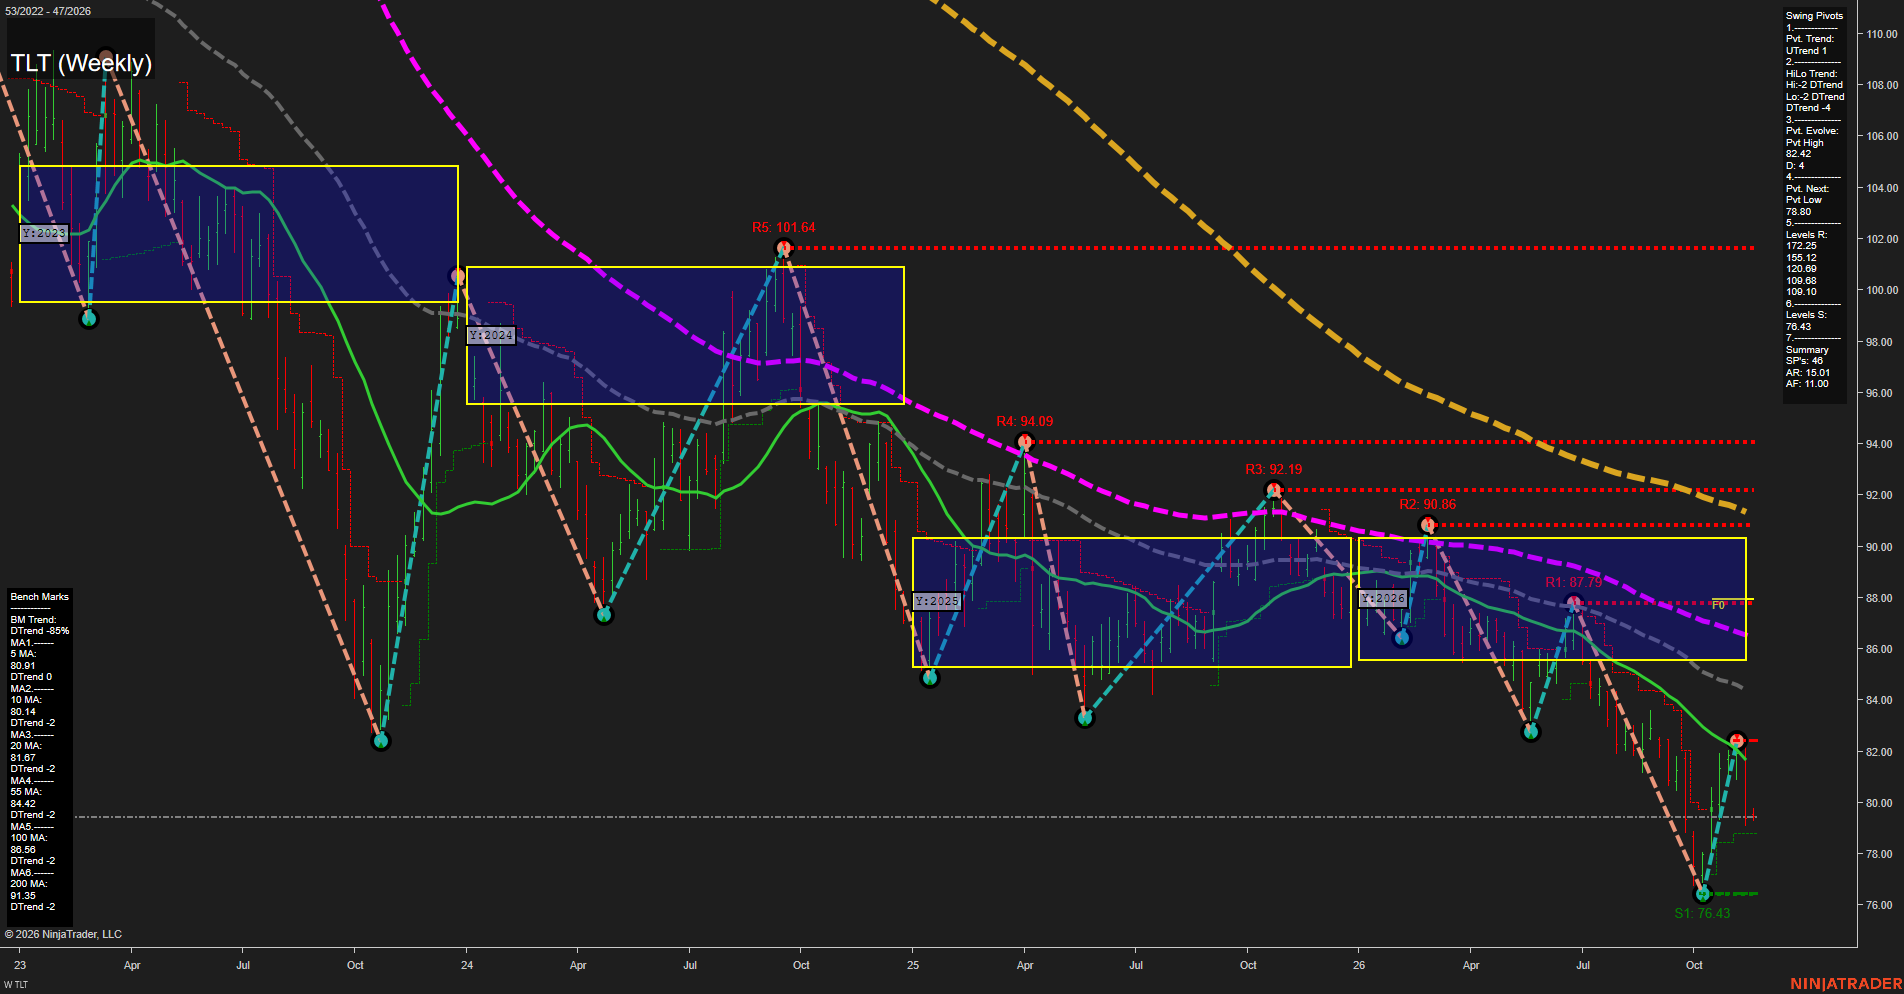
From a futures swing trader’s perspective, TLT shows a countertrend rebound within an established Treasury-price downtrend, rather than a confirmed bullish reversal. The near-term pivot uptrend contrasts with falling benchmark averages and a medium-term lower-high/lower-low structure. The rebound from 76.43 reached an evolving high of 82.42 before retreating below every listed benchmark; the latest small bar suggests slowing momentum after that rejection. The 78.80 next-pivot threshold and 76.43 swing low frame the nearby downside structure. Visible chart resistance lies at 87.79, 90.86, 92.19, 94.09 and 101.64; these differ from the historical resistance values explicitly listed in the pivot summary above. Price remains below the annual NTZ, approximately 85.6–90.3, and its F0% near 87.8, reinforcing the broader bearish regime. Weekly and monthly grids and the named recent-trade signal indicators are not visible, so their direction cannot be independently verified; their neutral entries are placeholders rather than confirmed readings. TLT provides a long-duration Treasury proxy, not a directly interchangeable futures price. No news or seasonal catalyst can be established from this chart alone.