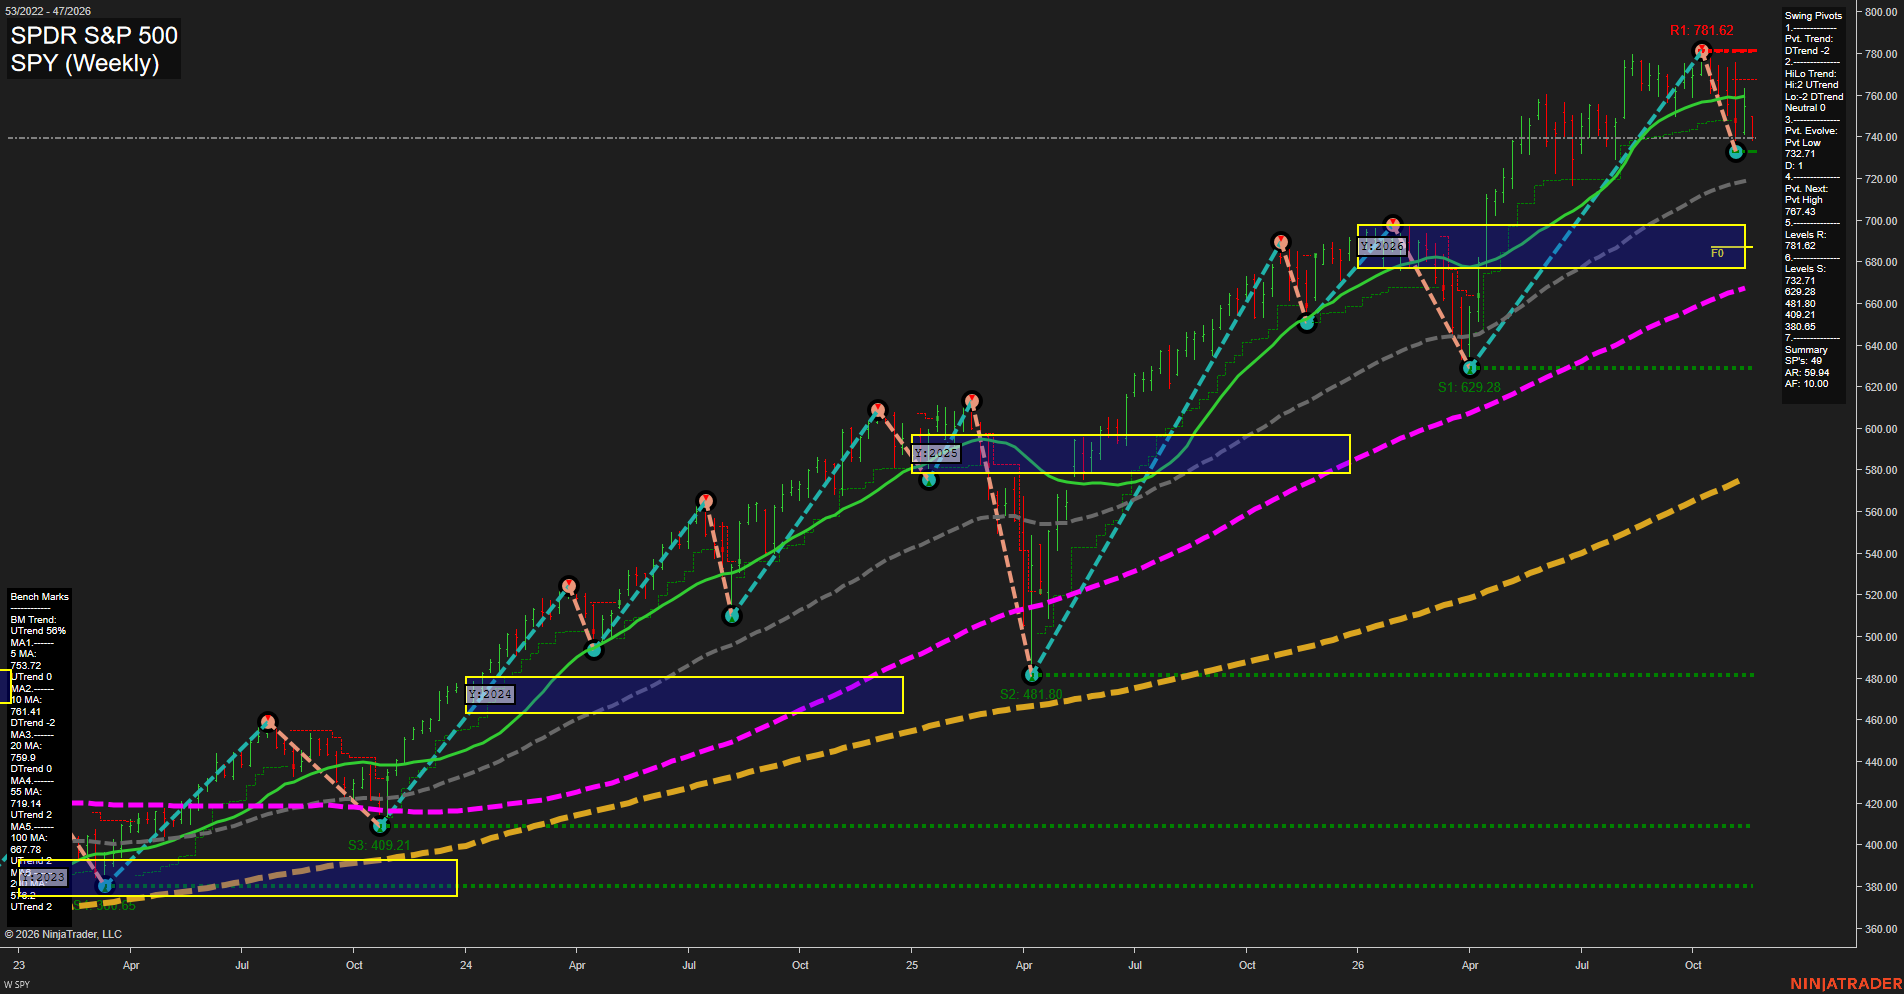
SPY SPDR S&P 500 Weekly Chart Analysis — After Market Close: 2026-Nov-16 15:13 CT
Price Action
- Last: Approximately 740,
- Bars: Large,
- Mom: Fast downside momentum, with an initial rebound from 732.71.
WSFG Weekly
- Near-Term
- WSFG Current: NA%
- F0%/NTZ' Bias: Price Neutral, unverified because the weekly grid is not displayed,
- WSFG Trend: Neutral.
MSFG Month Nov
- Medium-Term
- MSFG Current: NA%
- F0%/NTZ' Bias: Price Neutral, unverified because the monthly grid is not displayed,
- MSFG Trend: Neutral.
YSFG Year 2026
- Far-Term
- YSFG Current: NA%
- F0%/NTZ' Bias: Price Bullish, above the annual neutral zone around 677–698,
- YSFG Trend: Bullish.
Swing Pivots
- (Near-Term) 1. Pvt. Trend: DTrend,
- (Medium-Term) 2. HiLo Trend: Neutral, with high pivots in UTrend and low pivots in DTrend,
- 3. Pvt. Evolve: Pvt low 732.71,
- 4. Pvt. Next: Pvt high 767.43,
- 5. Levels R: 781.62,
- 6. Levels S: 732.71, 629.28, 481.80, 409.21, 380.65.
Weekly Benchmarks
- (Near-Term) 5 Week: 753.72 Up Trend,
- (Near-Term) 10 Week: 761.41 Down Trend,
- (Medium-Term) 20 Week: 759.90 Down Trend,
- (Medium-Term) 55 Week: 719.14 Up Trend,
- (Far-Term) 100 Week: 667.78 Up Trend,
- (Far-Term) 200 Week: Approximately 574 Up Trend.
Overall Rating
- Near-Term: Bearish,
- Medium-Term: Neutral,
- Far-Term: Bullish.
Key Insights Summary
From a futures swing trader’s perspective, this is a sharp corrective downswing within a still-rising long-term equity trend. The decline from 781.62 to 732.71 represents approximately 6.3%, breaking below the clustered 5-, 10-, and 20-week benchmarks. Those averages now define an overhead reference band around 754–761, while 767.43 is the displayed opposite-pivot reversal threshold. The mixed high/low pivot structure indicates medium-term instability rather than a confirmed, uniformly bearish trend. Price remains above the rising 55-week benchmark near 719 and the annual neutral zone, preserving the broader bullish framework. The rebound from 732.71 is preliminary and does not yet reverse the displayed pivot downtrend. These are SPY reference prices, not executable ES or MES futures levels. The named recent-signal indicators are not visible, so their direction cannot be verified; the chart alone also cannot establish news or seasonal drivers.
Chart Analysis ATS AI Generated: 2026-11-16 15:14 for Informational use only, not trading advice. Terms and Risk Disclosure Copyright © 2026. Algo Trading Systems LLC.