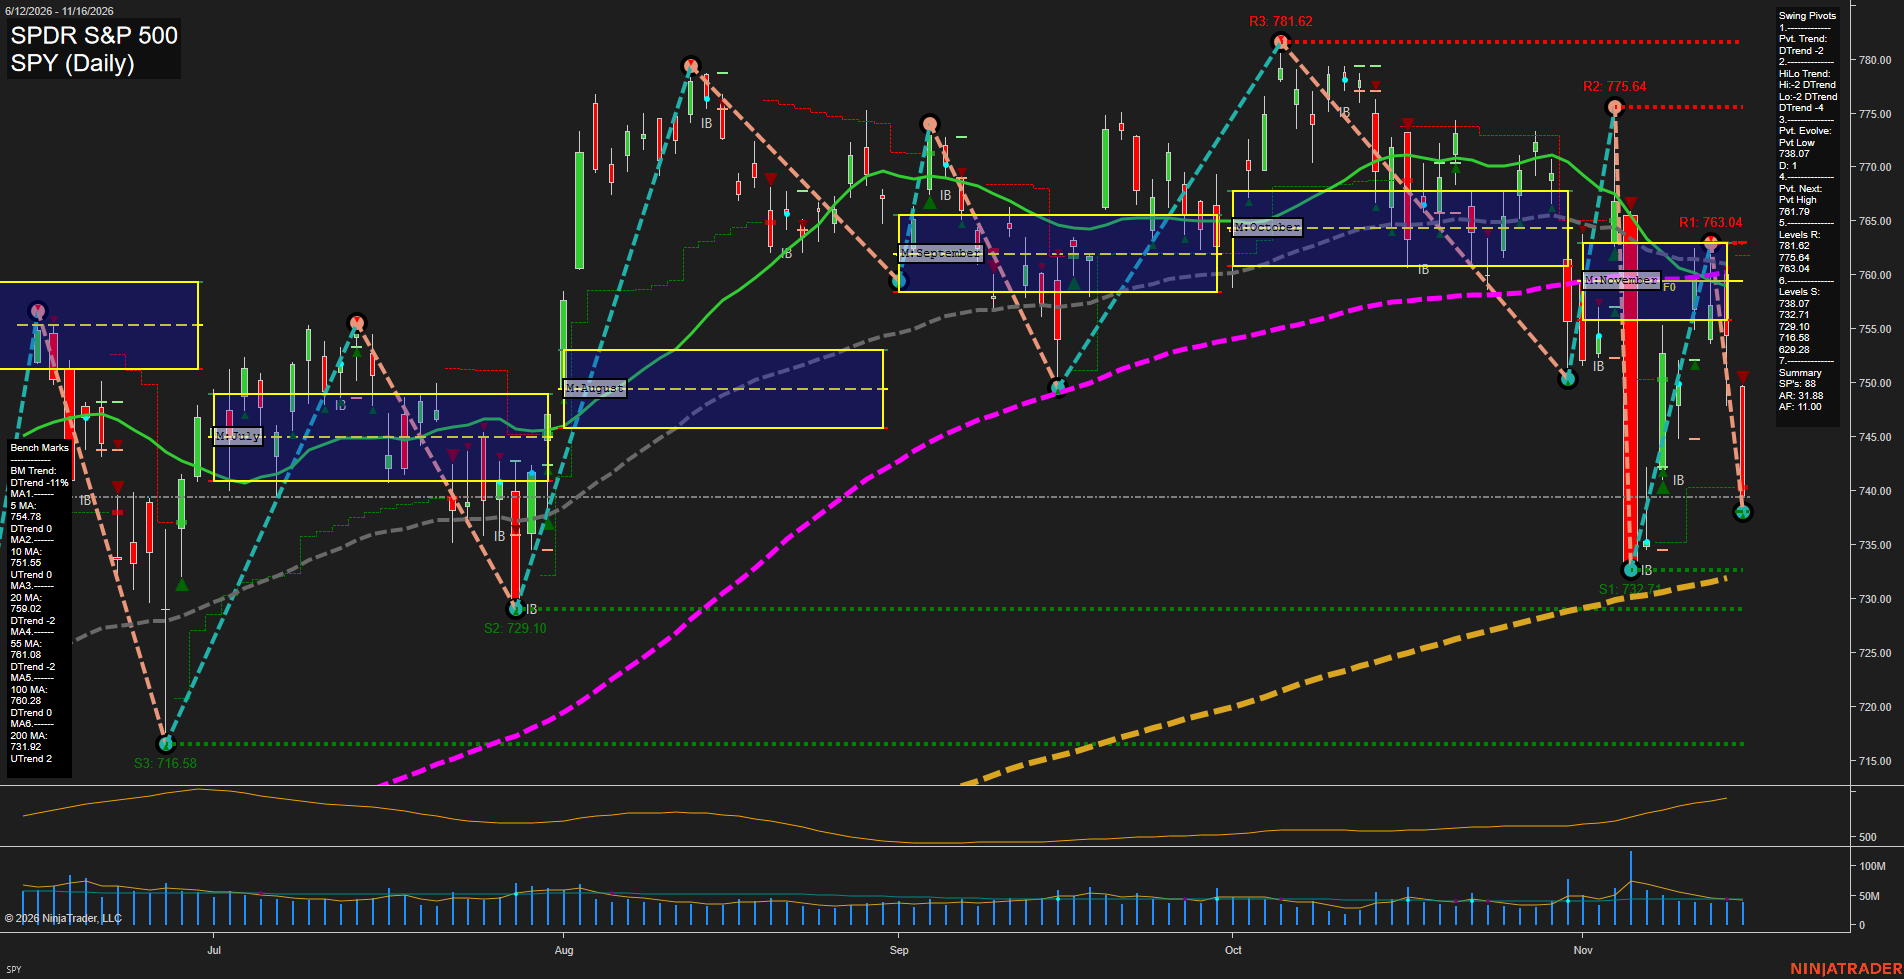
SPY SPDR S&P 500 Daily Chart Analysis — After Market Close: 2026-Nov-16 15:13 CT
Price Action
- Last: Approximately 739.50,
- Bars: Large,
- Mom: Momentum fast to the downside.
WSFG Weekly
- Near-Term
- WSFG Current: NA%
- F0%/NTZ' Bias: Price Neutral,
- WSFG Trend: Neutral.
MSFG Month Nov
- Medium-Term
- MSFG Current: NA%
- F0%/NTZ' Bias: Price below F0% and NTZ,
- MSFG Trend: Bearish.
YSFG Year 2026
- Far-Term
- YSFG Current: NA%
- F0%/NTZ' Bias: Price Neutral,
- YSFG Trend: Neutral.
Swing Pivots
- (Near-Term) 1. Pvt. Trend: DTrend,
- (Medium-Term) 2. HiLo Trend: DTrend,
- 3. Pvt. Evolve: Pvt low 738.07,
- 4. Pvt. Next: Pvt high 761.79,
- 5. Levels R: 781.62, 775.64, 763.04,
- 6. Levels S: 738.07, 732.71, 729.10, 716.58, 629.28.
Daily Benchmarks
- (Near-Term) 5 Day: 754.78 Down Trend,
- (Near-Term) 10 Day: 751.55 Up Trend,
- (Medium-Term) 20 Day: 759.02 Down Trend,
- (Medium-Term) 55 Day: 761.08 Down Trend,
- (Far-Term) 100 Day: 760.28 Down Trend,
- (Far-Term) 200 Day: 731.92 Up Trend.
Additional Metrics
- ATR: 564,
- VOLMA: 47470907.
Overall Rating
- Near-Term: Bearish,
- Medium-Term: Bearish,
- Far-Term: Neutral.
Key Insights Summary
From a futures swing trader’s perspective, SPY shows renewed downside expansion after a failed recovery into 763.04 resistance. The evolving 738.07 pivot low remains above the prior 732.71 low, but descending pivot highs and the summary’s bearish HiLo trend indicate that the rebound has not restored an uptrend. Price is below the 5-, 10-, 20-, 55- and 100-day benchmarks and November’s neutral trading zone, reinforcing bearish near- and medium-term structure. The rising 200-day benchmark at 731.92 sits near 732.71 support, defining an important longer-term reference area; its upward slope contrasts with the weakening 100-day benchmark. Rising ATR reflects expanding daily movement, while volume is below the early-November selloff spike. Weekly and yearly grids and named strategy-signal readings are not available in this image; their neutral entries represent unavailable confirmation. These are SPY reference prices, not executable futures levels, and the chart alone does not establish news or seasonal drivers.
Chart Analysis ATS AI Generated: 2026-11-16 15:13 for Informational use only, not trading advice. Terms and Risk Disclosure Copyright © 2026. Algo Trading Systems LLC.