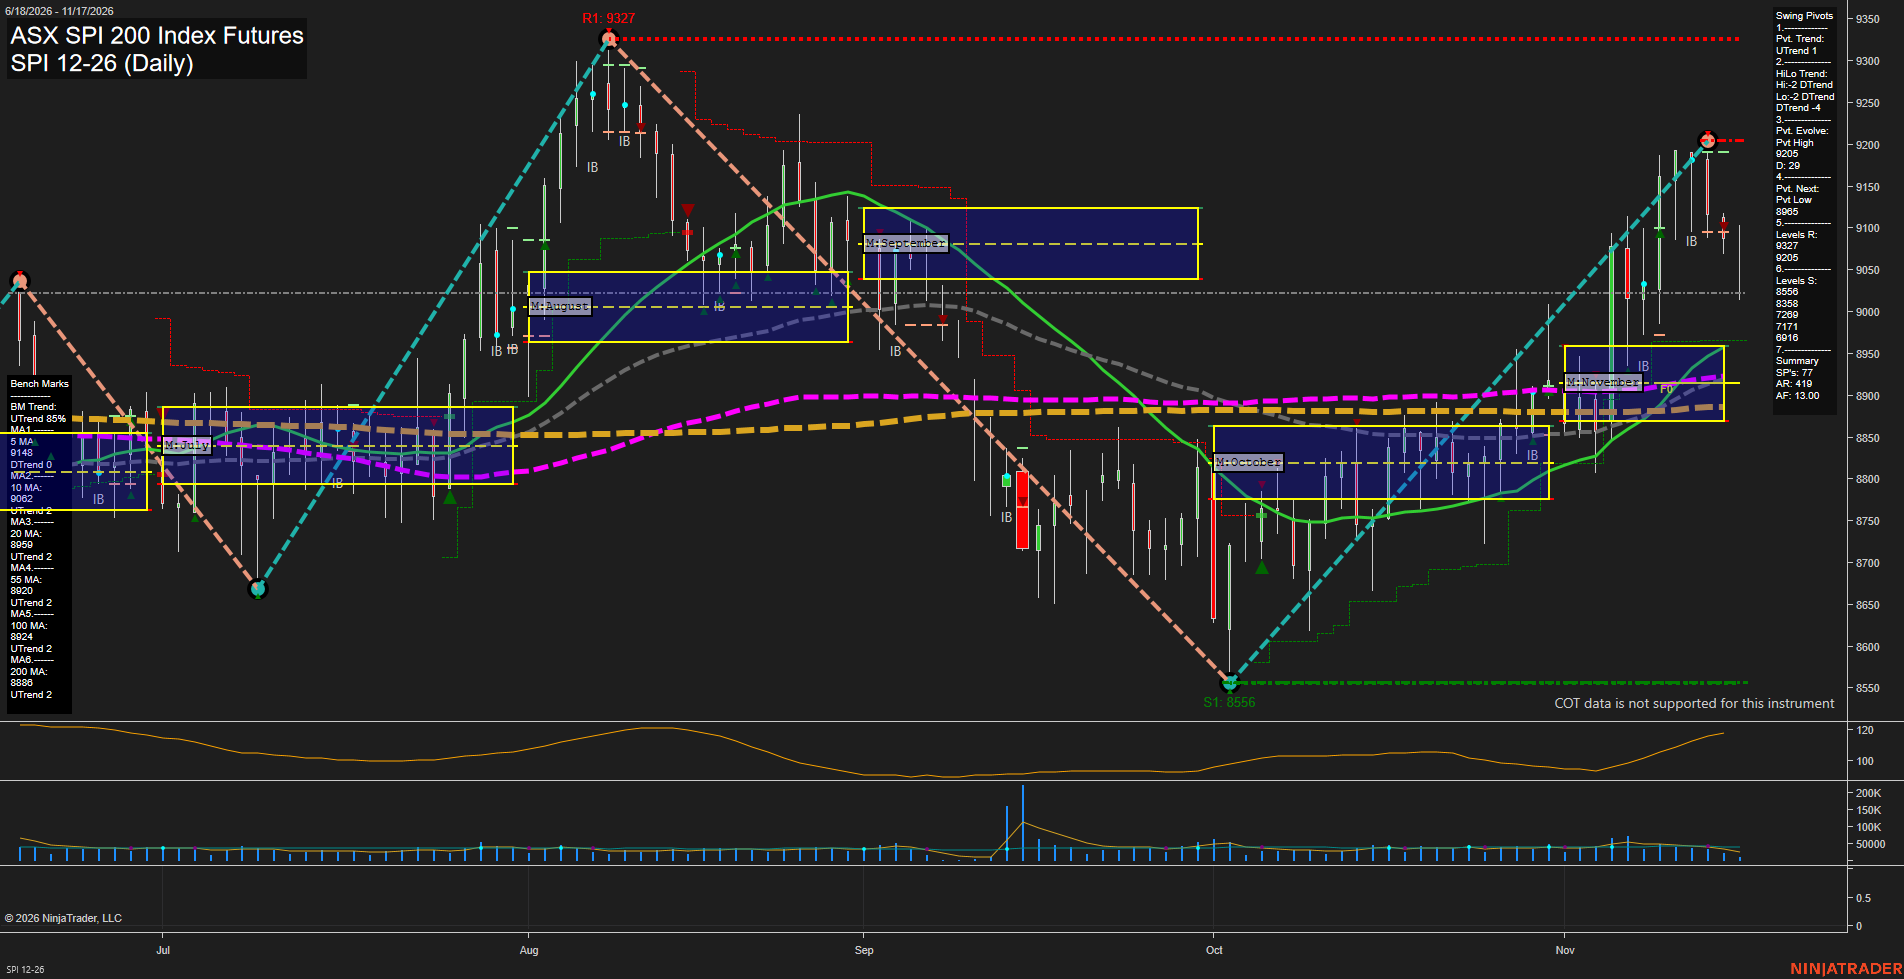
SPI ASX SPI 200 Index Futures Daily Chart Analysis — After Market Close: 2026-Nov-16 15:13 CT
Price Action
- Last: Approximately 9095,
- Bars: Small,
- Mom: Momentum slow.
WSFG Weekly
- Near-Term
- WSFG Current: NA%
- F0%/NTZ' Bias: Price Neutral,
- WSFG Trend: Neutral.
MSFG Month Nov
- Medium-Term
- MSFG Current: NA%
- F0%/NTZ' Bias: Price Bullish,
- MSFG Trend: Bullish.
YSFG Year 2026
- Far-Term
- YSFG Current: NA%
- F0%/NTZ' Bias: Price Neutral,
- YSFG Trend: Neutral.
Swing Pivots
- (Near-Term) 1. Pvt. Trend: UTrend,
- (Medium-Term) 2. HiLo Trend: DTrend,
- 3. Pvt. Evolve: Pvt high 9205,
- 4. Pvt. Next: Pvt low 8965,
- 5. Levels R: 9327, 9205,
- 6. Levels S: 8556, 8358, 7269, 7171, 6916.
Daily Benchmarks
- (Near-Term) 5 Day: 9148 Down Trend,
- (Near-Term) 10 Day: 9062 Up Trend,
- (Medium-Term) 20 Day: 8959 Up Trend,
- (Medium-Term) 55 Day: 8920 Up Trend,
- (Far-Term) 100 Day: 8924 Up Trend,
- (Far-Term) 200 Day: 8886 Up Trend.
Additional Metrics
- ATR: Approximately 118,
- VOLMA: 45319.
Overall Rating
- Near-Term: Bullish,
- Medium-Term: Bullish,
- Far-Term: Bullish.
Key Insights Summary
The recovery from October’s 8556 swing low remains the dominant active upswing, but rejection from the evolving 9205 high has shifted recent action into a small-bar pullback. Price is below the falling 5-day benchmark but remains above the rising 10-day benchmark, leaving the near-term bullish assessment qualified by slowing momentum. Medium-term evidence favors recovery, with price above November’s no-trade zone and rising 20-day and 55-day averages; however, the HiLo pivot structure remains bearish, so the rebound has not fully reversed the broader lower-high/lower-low sequence. Resistance is 9205, followed by 9327. The 8965 next-pivot reversal threshold is distinct from confirmed swing support at 8556. Rising 100-day and 200-day averages support the bullish far-term assessment. ATR near 118 indicates elevated daily movement despite the latest small bars. Weekly and yearly grids and the named strategy signals are not displayed, so their directional confirmation is unavailable; no news or seasonal catalyst can be established from this chart alone.
Chart Analysis ATS AI Generated: 2026-11-16 15:13 for Informational use only, not trading advice. Terms and Risk Disclosure Copyright © 2026. Algo Trading Systems LLC.