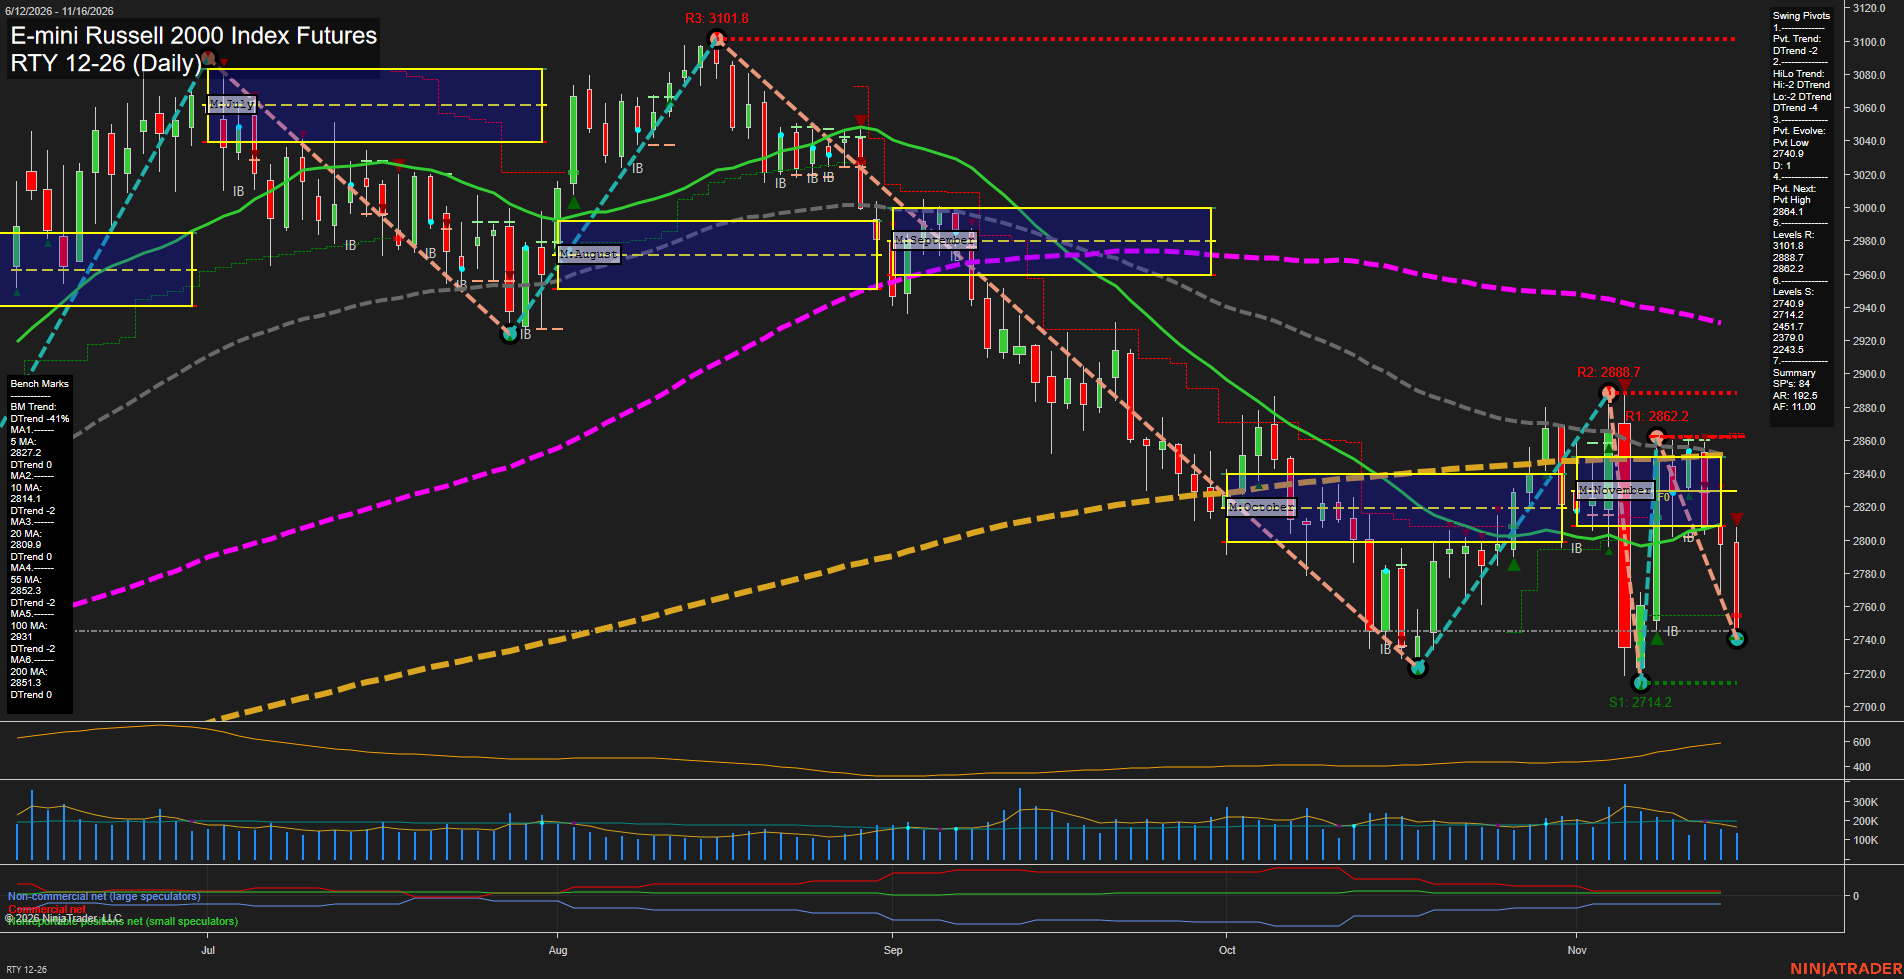
RTY E-mini Russell 2000 Index Futures Daily Chart Analysis — After Market Close: 2026-Nov-16 15:12 CT
Price Action
- Last: Approximately 2742,
- Bars: Large,
- Mom: Momentum fast.
WSFG Weekly
- Near-Term
- WSFG Current: -41%
- F0%/NTZ' Bias: Price Below,
- WSFG Trend: Down.
MSFG Month Nov
- Medium-Term
- MSFG Current: -53%
- F0%/NTZ' Bias: Price Below,
- MSFG Trend: Down.
YSFG Year 2026
- Far-Term
- YSFG Current: 25%
- F0%/NTZ' Bias: Price Above,
- YSFG Trend: Up.
Swing Pivots
- (Near-Term) 1. Pvt. Trend: DTrend,
- (Medium-Term) 2. HiLo Trend: DTrend,
- 3. Pvt. Evolve: Pvt low 2740.9,
- 4. Pvt. Next: Pvt high 2864.1,
- 5. Levels R: 3101.8, 2888.7, 2862.2,
- 6. Levels S: 2740.9, 2714.2, 2451.7, 2379.0, 2243.5.
Daily Benchmarks
- (Near-Term) 5 Day: 2827.2 Down Trend,
- (Near-Term) 10 Day: 2814.1 Down Trend,
- (Medium-Term) 20 Day: 2809.9 Down Trend,
- (Medium-Term) 55 Day: 2852.3 Down Trend,
- (Far-Term) 100 Day: 2931.4 Down Trend,
- (Far-Term) 200 Day: 2851.3 Down Trend.
Additional Metrics
Recent Trade Signals
- 16 Nov 2026: Short RTY 12-26 @ 2773.2 Signals.USAR-WSFG
- 13 Nov 2026: Short RTY 12-26 @ 2809.6 Signals.USAR-MSFG
- 12 Nov 2026: Short RTY 12-26 @ 2821.1 Signals.USAR.TR120
Overall Rating
- Near-Term: Bearish,
- Medium-Term: Bearish,
- Far-Term: Bearish.
Key Insights Summary
Price has accelerated lower from the November resistance area, breaking beneath the monthly NTZ and all six daily benchmarks. The rebound from 2714.2 failed below the earlier 2888.7 swing high, leaving a lower high at 2862.2 and a renewed downswing toward 2740.9 support. That evolving low remains above 2714.2, so the latest decline is testing the prior bottoming area rather than confirming a fresh low beneath it. Large alternating November bars and rising recent ATR show volatile, whipsaw-prone conditions, but the latest directional expansion favors sellers. Weekly, monthly, pivot and recent signal trends align bearishly. Far-term evidence is also predominantly bearish because both longer-term benchmarks are declining above price, despite the positive yearly grid reading. No specific news catalyst is established by the chart, and seasonal tendencies do not override the visible technical weakness.
Chart Analysis ATS AI Generated: 2026-11-16 15:12 for Informational use only, not trading advice. Terms and Risk Disclosure Copyright © 2026. Algo Trading Systems LLC.