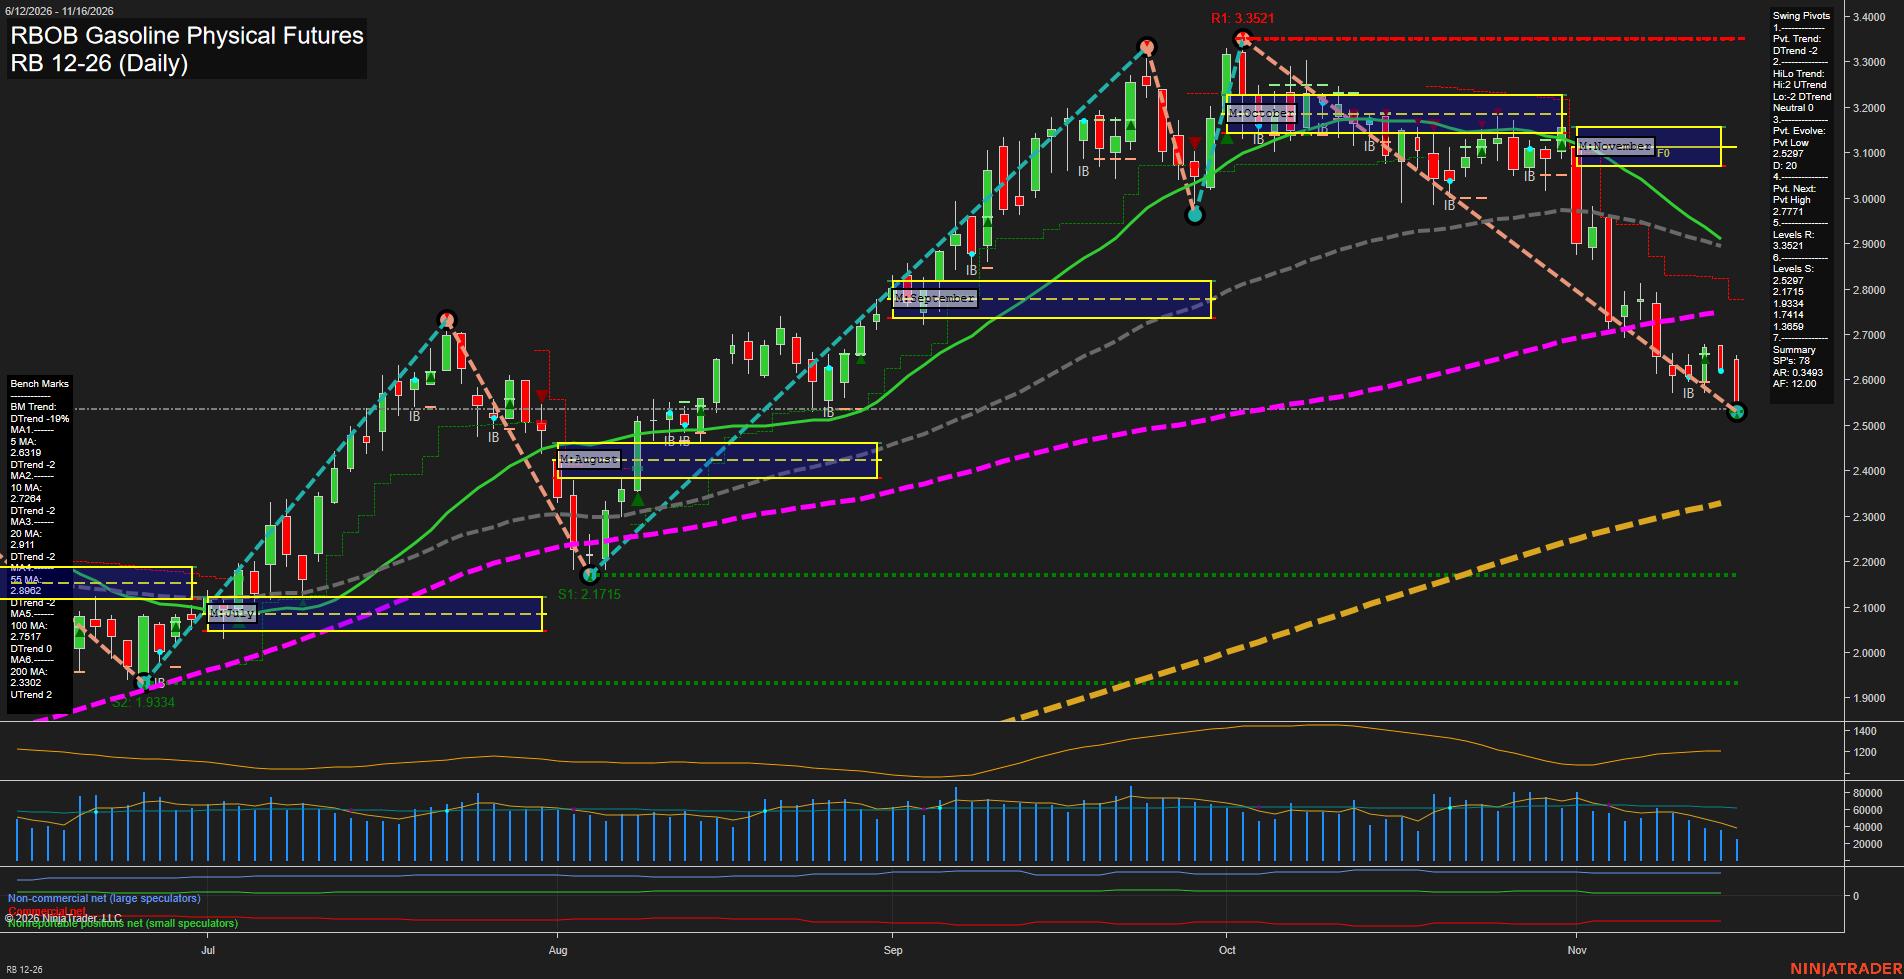
RB RBOB Gasoline Physical Futures Daily Chart Analysis — After Market Close: 2026-Nov-16 15:11 CT
Price Action
- Last: Approximately 2.5400,
- Bars: Large,
- Mom: Momentum fast.
WSFG Weekly
- Near-Term
- WSFG Current: -42%
- F0%/NTZ' Bias: Price Below,
- WSFG Trend: Down.
MSFG Month Nov
- Medium-Term
- MSFG Current: -121%
- F0%/NTZ' Bias: Price Below,
- MSFG Trend: Down.
YSFG Year 2026
- Far-Term
- YSFG Current: 177%
- F0%/NTZ' Bias: Price Above,
- YSFG Trend: Up.
Swing Pivots
- (Near-Term) 1. Pvt. Trend: DTrend,
- (Medium-Term) 2. HiLo Trend: Neutral, high pivots UTrend and low pivots DTrend,
- 3. Pvt. Evolve: Pvt low 2.5297,
- 4. Pvt. Next: Pvt high 2.7771,
- 5. Levels R: 3.3521,
- 6. Levels S: 2.5297, 2.1715, 1.9334, 1.7414, 1.3659.
Daily Benchmarks
- (Near-Term) 5 Day: 2.6319 Down Trend,
- (Near-Term) 10 Day: 2.7264 Down Trend,
- (Medium-Term) 20 Day: 2.9111 Down Trend,
- (Medium-Term) 55 Day: 2.8962 Down Trend,
- (Far-Term) 100 Day: 2.7517 Down Trend,
- (Far-Term) 200 Day: 2.3302 Up Trend.
Additional Metrics
Recent Trade Signals
- 16 Nov 2026: Short RB 12-26 @ 2.6023 Signals.USAR-WSFG
Overall Rating
- Near-Term: Bearish,
- Medium-Term: Bearish,
- Far-Term: Bullish.
Key Insights Summary
November’s breakdown has extended the decline from October’s 3.3521 swing high, with the latest large bearish bar finishing near the evolving 2.5297 pivot low. Failed rebounds and persistent downward momentum characterize a continuing selloff rather than a confirmed base. Price is below the declining 5-, 10-, 20- and 55-day benchmarks, while negative weekly and monthly grids reinforce the bearish swing structure. The medium-term high/low pivot reading remains mixed, but the broader technical evidence is bearish. Far-term conditions remain bullish by majority: the yearly grid is positive and price remains above the rising 200-day benchmark, although the break below the 100-day benchmark reflects substantial deterioration within that larger advance. The 2.7771 opposite-pivot threshold identifies the chart’s near-term reversal reference; 2.5297 is immediate pivot support, followed by 2.1715. Gasoline’s post-summer seasonal backdrop is consistent with softer demand, but the chart alone cannot establish a news-driven cause for this decline.
Chart Analysis ATS AI Generated: 2026-11-16 15:11 for Informational use only, not trading advice. Terms and Risk Disclosure Copyright © 2026. Algo Trading Systems LLC.