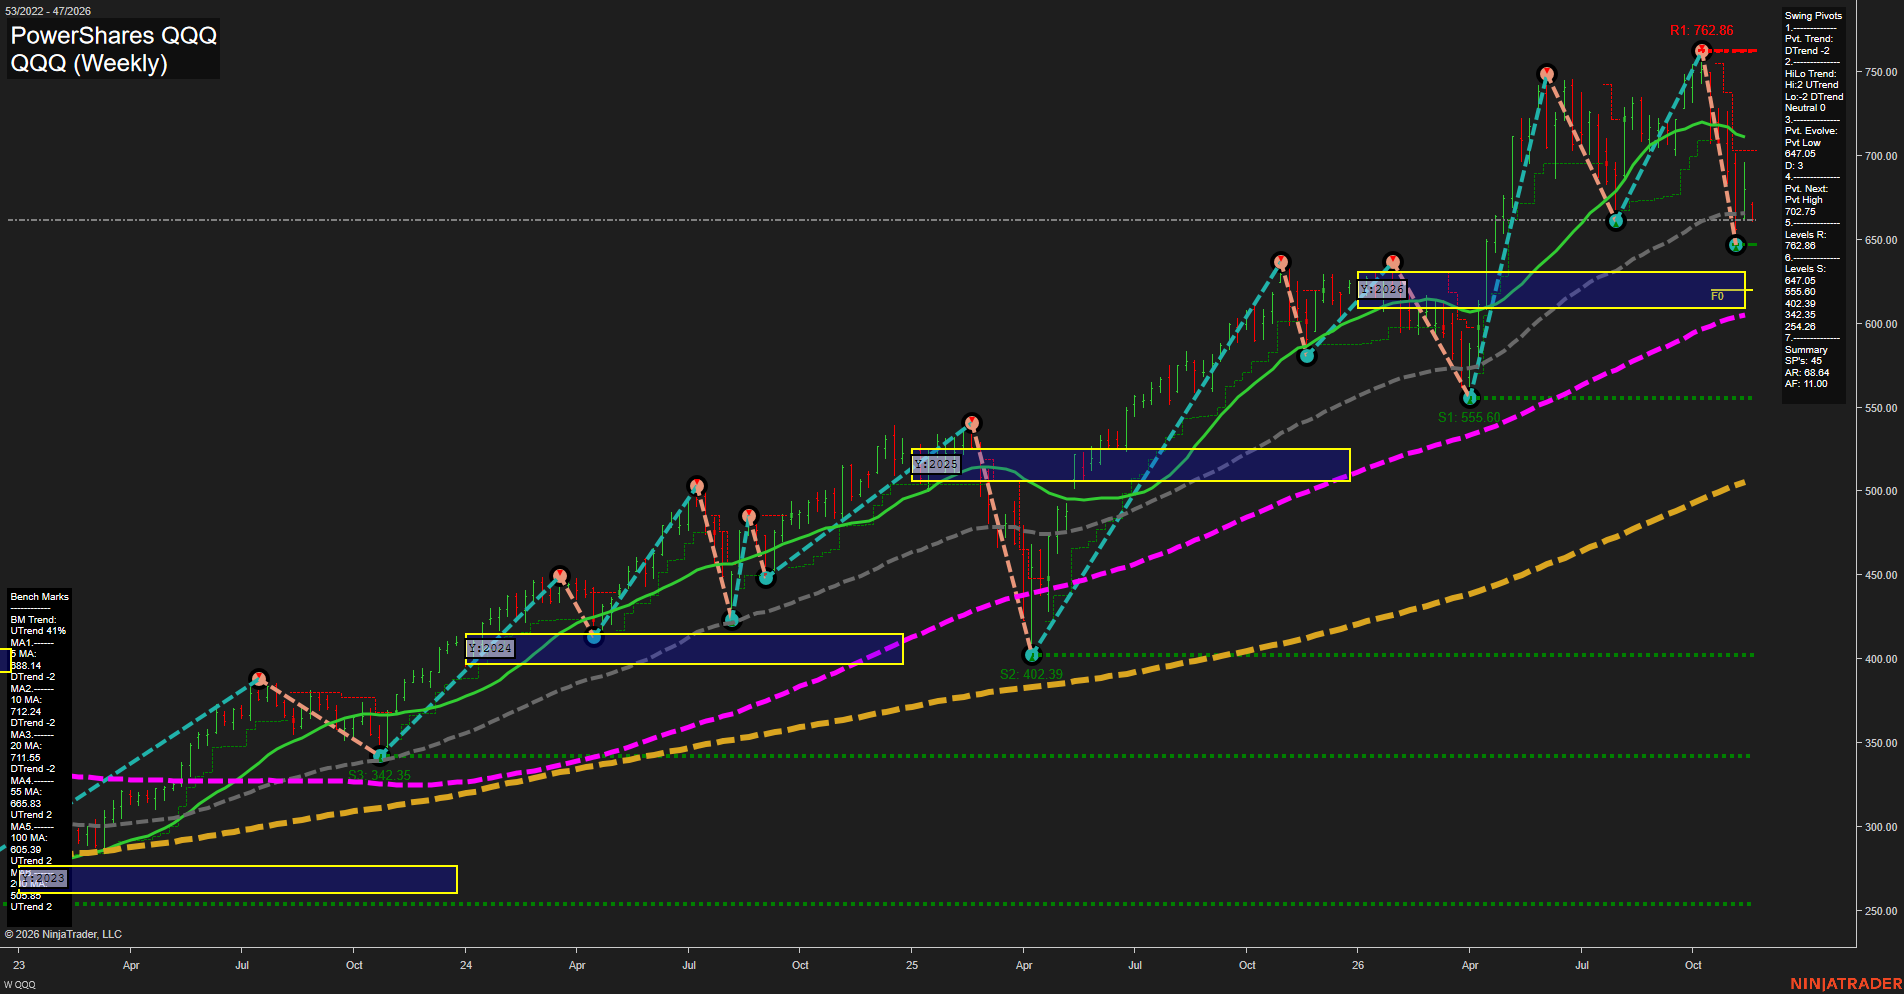
QQQ PowerShares QQQ Weekly Chart Analysis — After Market Close: 2026-Nov-16 15:11 CT
Price Action
- Last: Approximately 662,
- Bars: Large,
- Mom: Momentum fast.
WSFG Weekly
- Near-Term
- WSFG Current: NA%
- F0%/NTZ' Bias: Price Neutral,
- WSFG Trend: Neutral.
MSFG Month Nov
- Medium-Term
- MSFG Current: NA%
- F0%/NTZ' Bias: Price Neutral,
- MSFG Trend: Neutral.
YSFG Year 2026
- Far-Term
- YSFG Current: NA%
- F0%/NTZ' Bias: Price above NTZ,
- YSFG Trend: Bullish.
Swing Pivots
- (Near-Term) 1. Pvt. Trend: DTrend,
- (Medium-Term) 2. HiLo Trend: Neutral, with higher highs and lower lows,
- 3. Pvt. Evolve: Pvt low 647.05,
- 4. Pvt. Next: Pvt high 702.75,
- 5. Levels R: 762.86,
- 6. Levels S: 647.05, 555.60, 402.39, 342.35, 254.26.
Weekly Benchmarks
- (Near-Term) 5 Week: 688.14 Down Trend,
- (Near-Term) 10 Week: 712.24 Down Trend,
- (Medium-Term) 20 Week: 711.55 Down Trend,
- (Medium-Term) 55 Week: 665.83 Up Trend,
- (Far-Term) 100 Week: 605.39 Up Trend,
- (Far-Term) 200 Week: Approximately 505.83 Up Trend.
Overall Rating
- Near-Term: Bearish,
- Medium-Term: Neutral,
- Far-Term: Bullish.
Key Insights Summary
From a futures swing trader’s perspective, QQQ shows a fast downside correction within a longer-term rising structure, rather than a confirmed broad trend reversal. The decline from 762.86 to the evolving 647.05 pivot low has pushed price below the falling 5-, 10- and 20-week benchmarks and marginally below the rising 55-week benchmark. Higher swing highs alongside lower swing lows indicate expanding volatility and a mixed medium-term structure. The next opposite pivot threshold is 702.75; 647.05 is the nearest listed support. Price remains above the yearly neutral zone, approximately 610–631, and the rising 100- and 200-week benchmarks. Weekly and monthly grids and the requested USAR signals are not visible, so their directional confirmation is unavailable; their neutral entries do not establish observed neutrality. QQQ provides Nasdaq-related context, but these prices are ETF levels, not NQ futures levels. News and seasonal drivers cannot be established from this chart alone.
Chart Analysis ATS AI Generated: 2026-11-16 15:11 for Informational use only, not trading advice. Terms and Risk Disclosure Copyright © 2026. Algo Trading Systems LLC.