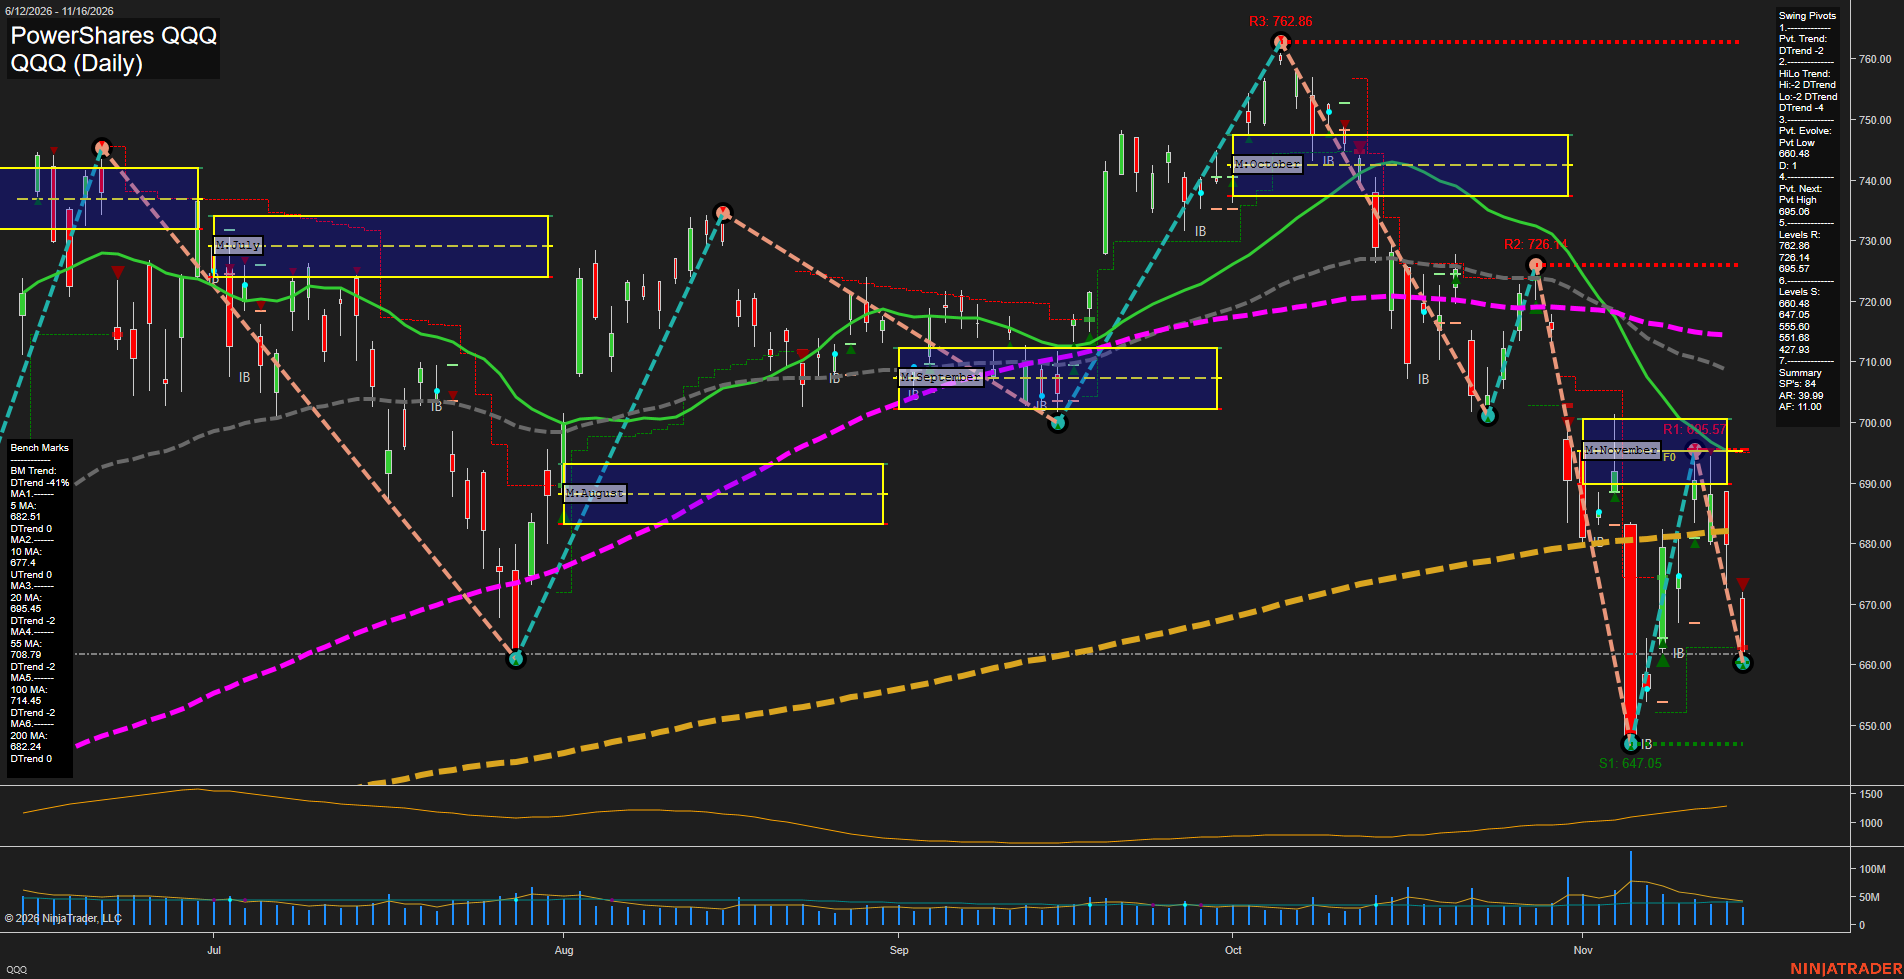
QQQ PowerShares QQQ Daily Chart Analysis — After Market Close: 2026-Nov-16 15:11 CT
Price Action
- Last: Approximately 662,
- Bars: Large,
- Mom: Momentum fast.
WSFG Weekly
- Near-Term
- WSFG Current: NA%
- F0%/NTZ' Bias: Price Neutral,
- WSFG Trend: Neutral.
MSFG Month Nov
- Medium-Term
- MSFG Current: NA%
- F0%/NTZ' Bias: Price Neutral,
- MSFG Trend: Neutral.
YSFG Year 2026
- Far-Term
- YSFG Current: NA%
- F0%/NTZ' Bias: Price Neutral,
- YSFG Trend: Neutral.
Swing Pivots
- (Near-Term) 1. Pvt. Trend: DTrend,
- (Medium-Term) 2. HiLo Trend: DTrend,
- 3. Pvt. Evolve: Pvt low 660.48,
- 4. Pvt. Next: Pvt high 695.06,
- 5. Levels R: 762.86, 726.14, 695.57,
- 6. Levels S: 660.48, 647.05, 555.60, 551.68, 427.93.
Daily Benchmarks
- (Near-Term) 5 Day: 682.51 Down Trend,
- (Near-Term) 10 Day: 677.4 Up Trend,
- (Medium-Term) 20 Day: 695.45 Down Trend,
- (Medium-Term) 55 Day: 708.79 Down Trend,
- (Far-Term) 100 Day: 714.45 Down Trend,
- (Far-Term) 200 Day: 682.24 Down Trend.
Additional Metrics
- ATR: 733,
- VOLMA: 32709273.
Overall Rating
- Near-Term: Bearish,
- Medium-Term: Bearish,
- Far-Term: Bearish.
Key Insights Summary
From a futures swing-trader perspective, QQQ shows a bearish impulse–retracement–continuation sequence rather than an established reversal. The rebound from 647.05 stalled at 695.57, forming another lower high, followed by a sharp decline toward the evolving 660.48 pivot low. Price is below all six benchmarks, including the 200-day average, while the 20-, 55-, and 100-day benchmarks confirm broader deterioration. The 660.48 and 647.05 levels define the nearest downside reference points; overhead resistance begins around the 677–683 benchmark cluster, followed by 695.57. Large daily ranges and the rising ATR plot indicate expanding volatility. Although the grid fields above remain neutral placeholders, price visually sits below November’s NTZ, reinforcing the bearish technical context. QQQ provides a Nasdaq equity-risk proxy, not an executable futures price; futures basis and overnight trading can produce different levels. Weekly and yearly grids, named trade-signal readings, and news catalysts are not available in the image.
Chart Analysis ATS AI Generated: 2026-11-16 15:11 for Informational use only, not trading advice. Terms and Risk Disclosure Copyright © 2026. Algo Trading Systems LLC.