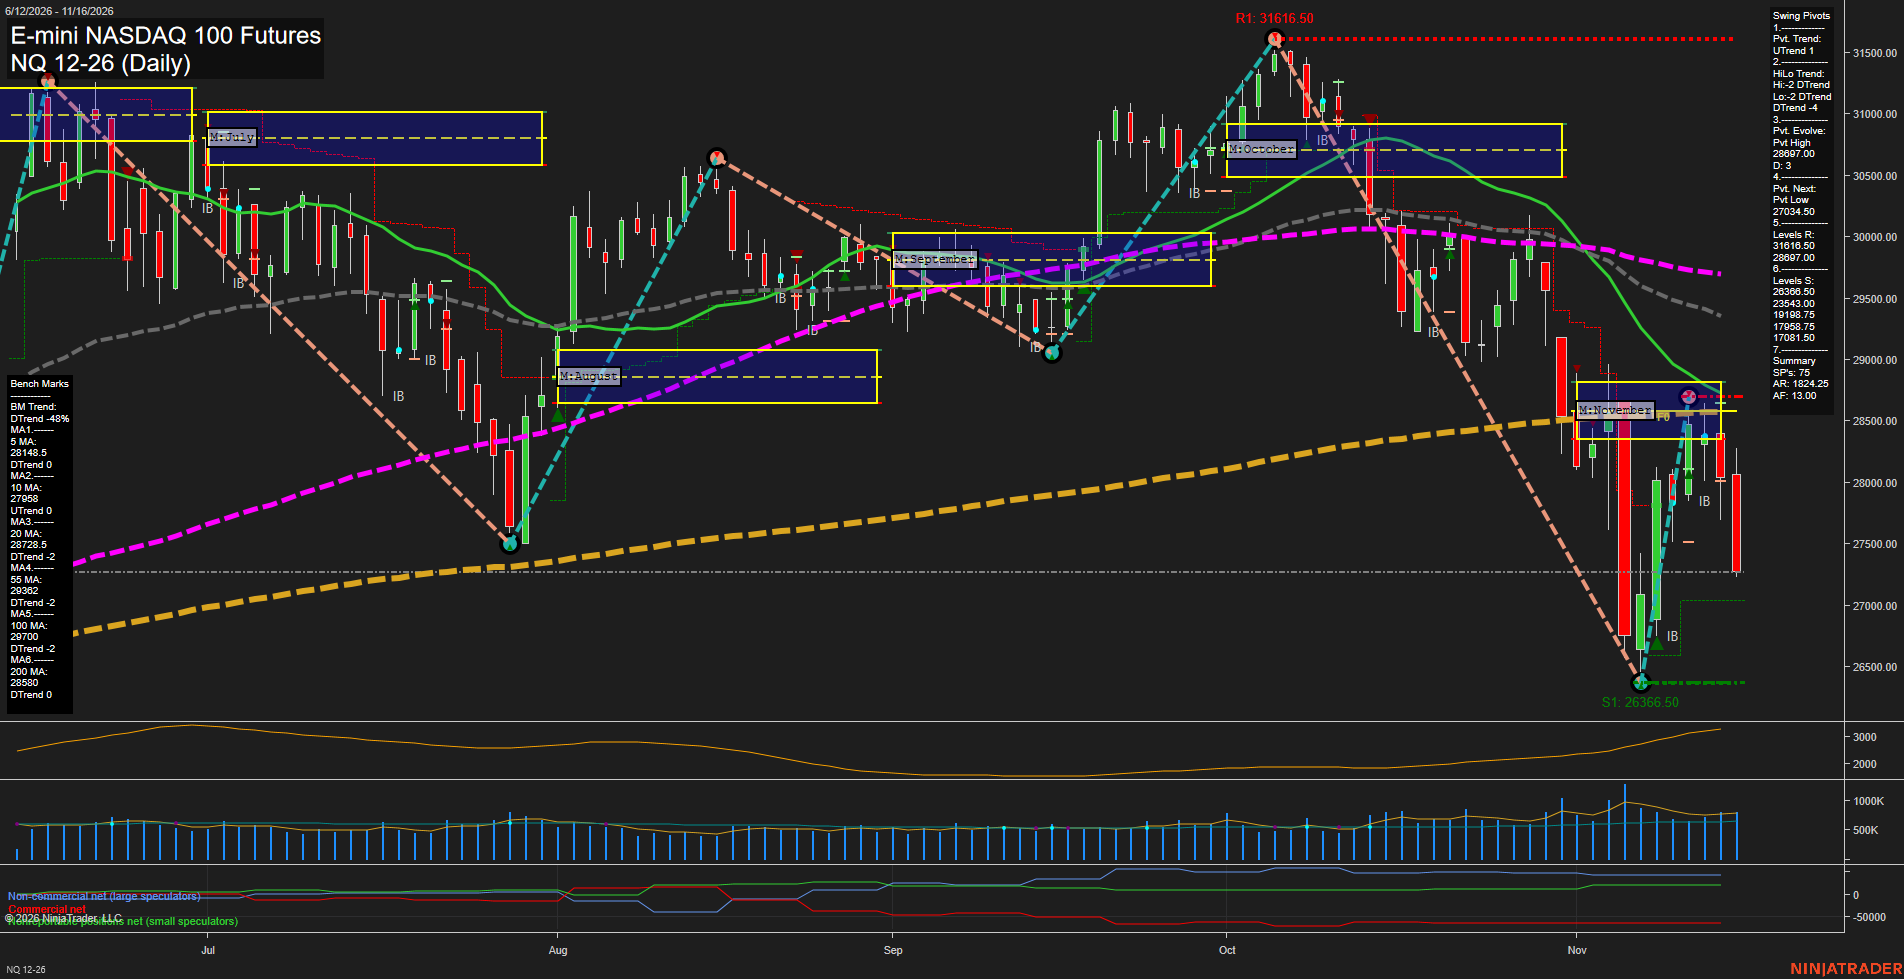
NQ E-mini NASDAQ 100 Futures Daily Chart Analysis — After Market Close: 2026-Nov-16 15:10 CT
Price Action
- Last: Approximately 27,275,
- Bars: Large,
- Mom: Momentum fast to the downside.
WSFG Weekly
- Near-Term
- WSFG Current: -40%
- F0%/NTZ' Bias: Price Below,
- WSFG Trend: Down.
MSFG Month Nov
- Medium-Term
- MSFG Current: -54%
- F0%/NTZ' Bias: Price Below,
- MSFG Trend: Down.
YSFG Year 2026
- Far-Term
- YSFG Current: 15%
- F0%/NTZ' Bias: Price Above,
- YSFG Trend: Up.
Swing Pivots
- (Near-Term) 1. Pvt. Trend: UTrend,
- (Medium-Term) 2. HiLo Trend: DTrend,
- 3. Pvt. Evolve: Pvt high 28,697.00,
- 4. Pvt. Next: Pvt low 27,034.50,
- 5. Levels R: 31,616.50, 28,697.00,
- 6. Levels S: 26,366.50, 23,543.00, 19,198.75, 17,958.75, 17,081.50.
Daily Benchmarks
- (Near-Term) 5 Day: 28,148.5 Down Trend,
- (Near-Term) 10 Day: 27,958 Up Trend,
- (Medium-Term) 20 Day: 28,728.5 Down Trend,
- (Medium-Term) 55 Day: 29,362 Down Trend,
- (Far-Term) 100 Day: 29,700 Down Trend,
- (Far-Term) 200 Day: 28,580 Down Trend.
Additional Metrics
- ATR: 2753,
- VOLMA: 824528.
Recent Trade Signals
- 16 Nov 2026: Short NQ 12-26 @ 27861.25 Signals.USAR.TR120
- 16 Nov 2026: Short NQ 12-26 @ 27861.25 Signals.USAR-WSFG
Overall Rating
- Near-Term: Bearish,
- Medium-Term: Bearish,
- Far-Term: Bearish.
Key Insights Summary
From a futures swing-trading perspective, the rebound from 26,366.50 to 28,697.00 currently resembles a countertrend recovery within the broader decline from 31,616.50. The latest large bearish candle reverses much of that recovery, leaving price below all six daily benchmarks and below the weekly and monthly neutral zones. The pivot summary still registers a near-term UTrend, but weakening price action contrasts with that designation; 27,034.50 is the listed opposite-pivot reversal threshold. Medium-term lower highs and lower lows reinforce the bearish structure, with 26,366.50 the nearest listed swing support and 28,697.00 the nearest listed swing resistance. The positive yearly grid remains a longer-horizon counterweight, although both far-term benchmark trends are down. Recent short signals align with the renewed downside momentum. News catalysts and seasonal effects cannot be established from this chart alone.
Chart Analysis ATS AI Generated: 2026-11-16 15:10 for Informational use only, not trading advice. Terms and Risk Disclosure Copyright © 2026. Algo Trading Systems LLC.