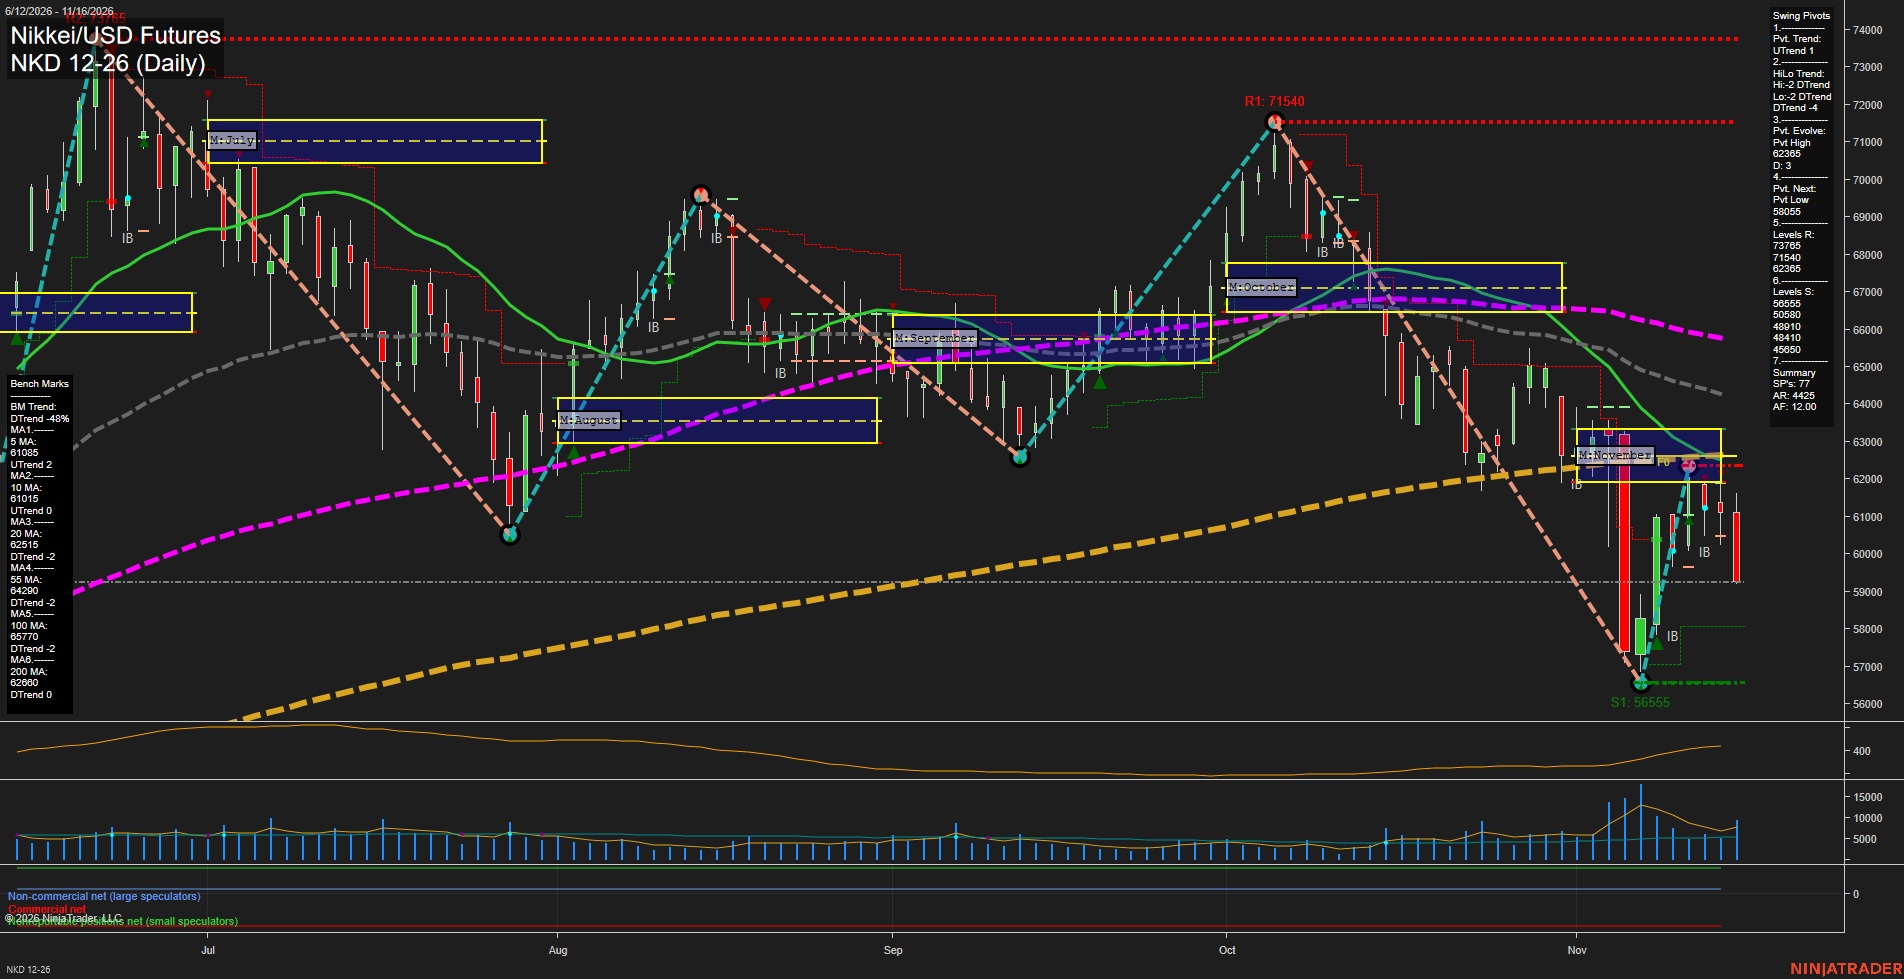
NKD Nikkei/USD Futures Daily Chart Analysis — After Market Close: 2026-Nov-16 15:09 CT
Price Action
- Last: Approximately 59250,
- Bars: Large,
- Mom: Momentum fast to the downside.
WSFG Weekly
- Near-Term
- WSFG Current: -38%
- F0%/NTZ' Bias: Price Below,
- WSFG Trend: Down.
MSFG Month Nov
- Medium-Term
- MSFG Current: -44%
- F0%/NTZ' Bias: Price Below,
- MSFG Trend: Down.
YSFG Year 2026
- Far-Term
- YSFG Current: 103%
- F0%/NTZ' Bias: Price Above,
- YSFG Trend: Up.
Swing Pivots
- (Near-Term) 1. Pvt. Trend: UTrend,
- (Medium-Term) 2. HiLo Trend: DTrend,
- 3. Pvt. Evolve: Pvt high 62365,
- 4. Pvt. Next: Pvt low 58055,
- 5. Levels R: 73765, 71540, 62365,
- 6. Levels S: 56555, 50580, 48910, 48410, 45650.
Daily Benchmarks
- (Near-Term) 5 Day: 61085 Up Trend,
- (Near-Term) 10 Day: 61015 Up Trend,
- (Medium-Term) 20 Day: 62515 Down Trend,
- (Medium-Term) 55 Day: 64290 Down Trend,
- (Far-Term) 100 Day: 65770 Down Trend,
- (Far-Term) 200 Day: 62680 Down Trend.
Additional Metrics
Overall Rating
- Near-Term: Bullish,
- Medium-Term: Bearish,
- Far-Term: Bearish.
Key Insights Summary
The near-term bullish rating reflects the majority of designated indicators: an upward pivot trend and upward 5- and 10-day benchmark trends. However, the latest large red candle, close below both short-term averages, and negative weekly grid show that rebound momentum is deteriorating. The recovery from 56555 reached an evolving pivot high at 62365 before rejection near the November NTZ and the 20- and 200-day benchmarks. This remains a countertrend rebound within a medium-term lower-high/lower-low structure, with 58055 marking the next pivot-reversal threshold and 56555 the nearest established swing support. Price below all six benchmarks reinforces the broader bearish technical alignment, although the positive yearly grid remains a conflicting long-horizon influence. Recent ranges and volume show an active, volatile market rather than quiet consolidation. The supplied chart does not establish news catalysts, seasonal effects, or readable direction readings for the four named signal systems.
Chart Analysis ATS AI Generated: 2026-11-16 15:10 for Informational use only, not trading advice. Terms and Risk Disclosure Copyright © 2026. Algo Trading Systems LLC.