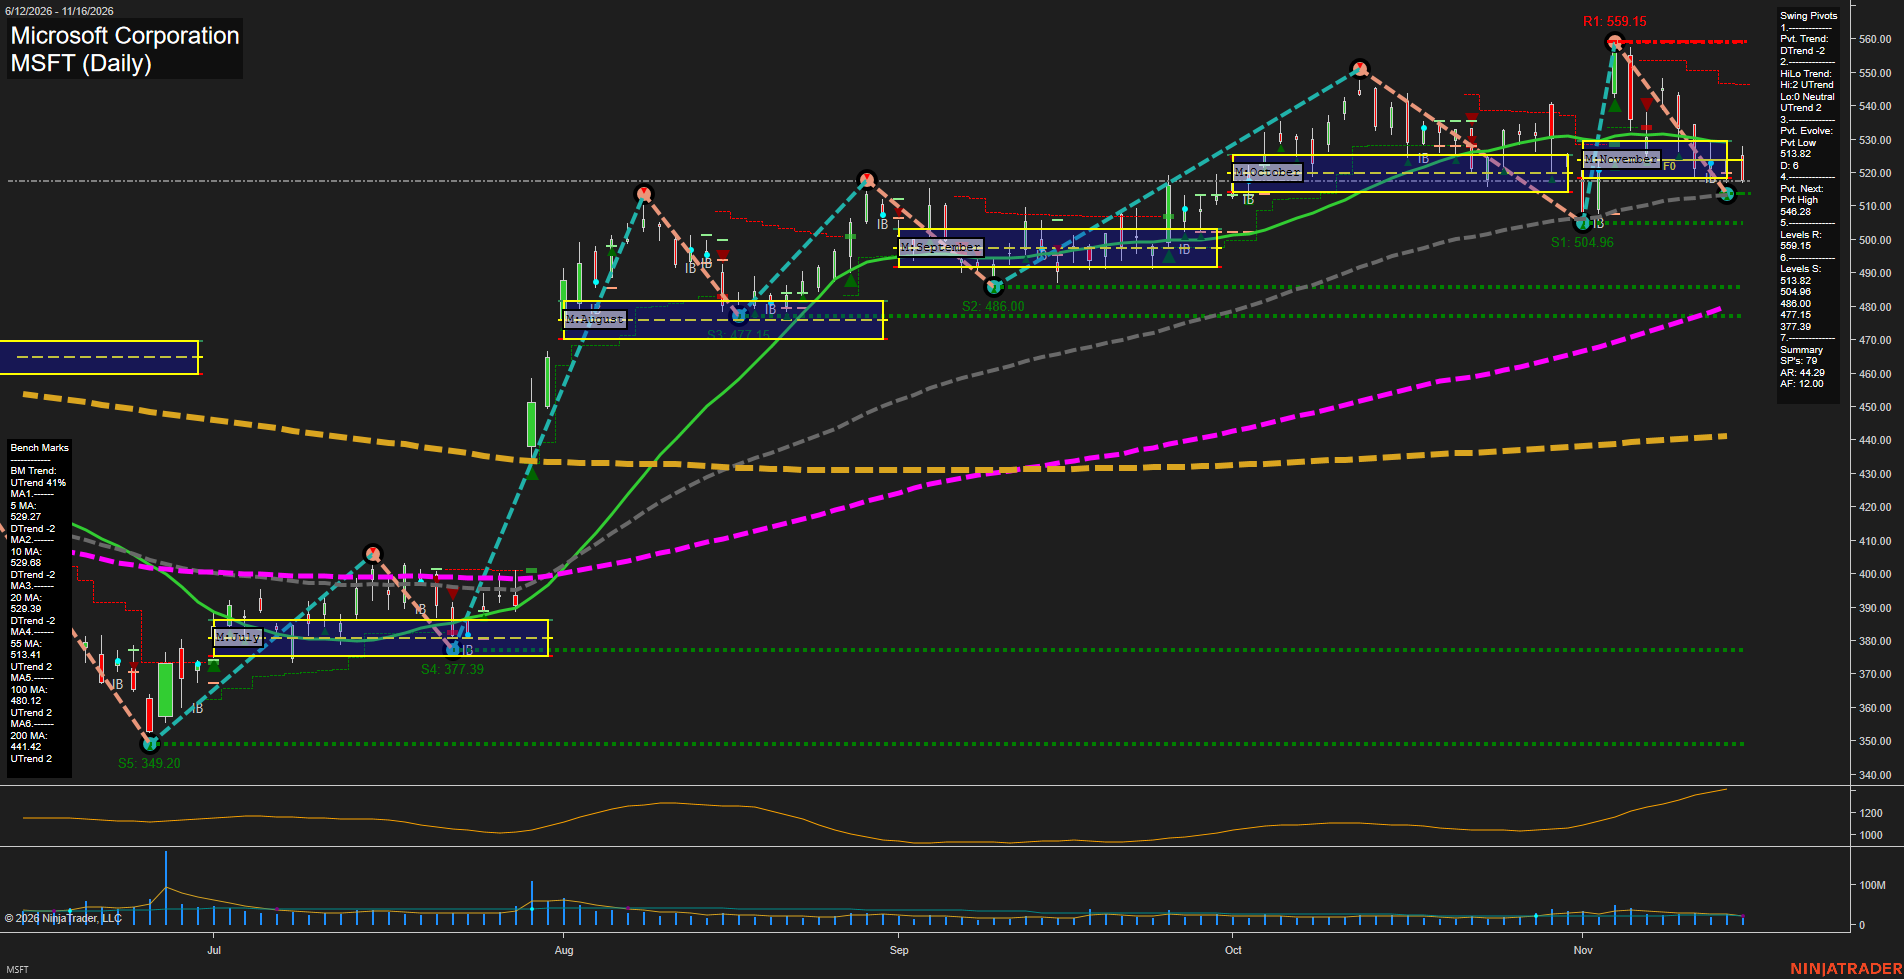
MSFT Microsoft Corporation Daily Chart Analysis — After Market Close: 2026-Nov-16 15:08 CT
Price Action
- Last: approximately 517.50,
- Bars: Medium,
- Mom: Momentum fast.
WSFG Weekly
- Near-Term
- WSFG Current: NA%
- F0%/NTZ' Bias: Price Neutral,
- WSFG Trend: Neutral.
MSFG Month Nov
- Medium-Term
- MSFG Current: NA%
- F0%/NTZ' Bias: Price Neutral,
- MSFG Trend: Neutral.
YSFG Year 2026
- Far-Term
- YSFG Current: NA%
- F0%/NTZ' Bias: Price Neutral,
- YSFG Trend: Neutral.
Swing Pivots
- (Near-Term) 1. Pvt. Trend: DTrend,
- (Medium-Term) 2. HiLo Trend: UTrend,
- 3. Pvt. Evolve: Pvt low 513.82,
- 4. Pvt. Next: Pvt high 548.28,
- 5. Levels R: 559.15,
- 6. Levels S: 513.82, 504.96, 486.00, 477.15, 377.39.
Daily Benchmarks
- (Near-Term) 5 Day: 529.27 Down Trend,
- (Near-Term) 10 Day: 529.68 Down Trend,
- (Medium-Term) 20 Day: 529.39 Down Trend,
- (Medium-Term) 55 Day: 513.41 Up Trend,
- (Far-Term) 100 Day: 480.12 Up Trend,
- (Far-Term) 200 Day: 441.42 Up Trend.
Additional Metrics
- ATR: 791,
- VOLMA: 26357793.
Overall Rating
- Near-Term: Bearish,
- Medium-Term: Bullish,
- Far-Term: Bullish.
Key Insights Summary
From a futures swing trader’s perspective, MSFT shows a fast countertrend downswing within a broader rising structure, rather than a confirmed major-trend reversal. The decline from 559.15 has placed price below the falling 5-, 10-, and 20-day benchmarks, with resistance clustered around 529–530. The developing 513.82 pivot low sits close to the rising 55-day benchmark at 513.41, creating a concentrated support test; 504.96 is the next lower recorded support. Medium-term structure remains constructive because the HiLo trend and 55-day benchmark still rise, although the falling 20-day benchmark creates mixed conditions. Rising 100- and 200-day benchmarks support the bullish far-term rating. The ATR plot is rising, indicating expanding daily ranges. Weekly and yearly grids and named recent signal readings are not displayed, so their neutral placeholders are not independently confirmed. This is an equity chart, not a futures contract; futures-specific positioning, basis, and roll effects cannot be inferred. News and seasonal drivers are not established by the image.
Chart Analysis ATS AI Generated: 2026-11-16 15:08 for Informational use only, not trading advice. Terms and Risk Disclosure Copyright © 2026. Algo Trading Systems LLC.