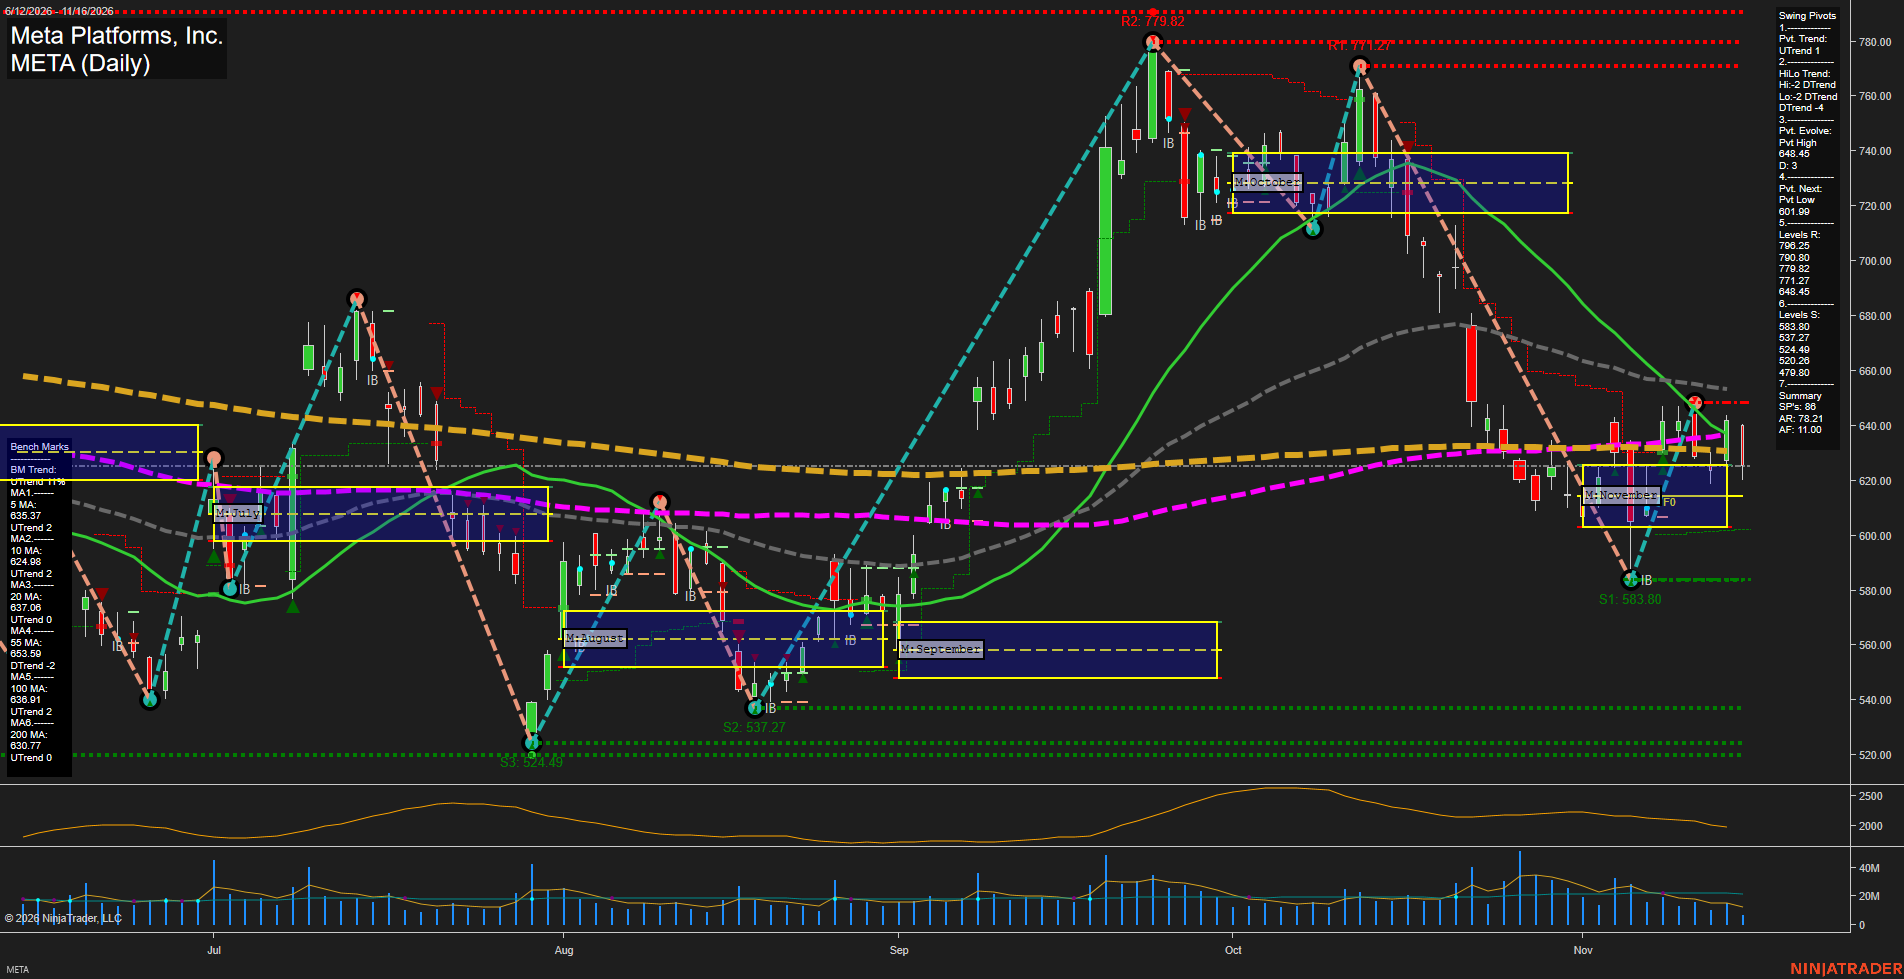
META Meta Platforms; Inc. Daily Chart Analysis — After Market Close: 2026-Nov-16 15:08 CT
Price Action
- Last: approximately 625.00,
- Bars: Medium,
- Mom: Momentum slow.
WSFG Weekly
- Near-Term
- WSFG Current: NA%
- F0%/NTZ' Bias: Price Neutral,
- WSFG Trend: Neutral.
MSFG Month Nov
- Medium-Term
- MSFG Current: NA%
- F0%/NTZ' Bias: Price Neutral,
- MSFG Trend: Neutral.
YSFG Year 2026
- Far-Term
- YSFG Current: NA%
- F0%/NTZ' Bias: Price Neutral,
- YSFG Trend: Neutral.
Swing Pivots
- (Near-Term) 1. Pvt. Trend: UTrend,
- (Medium-Term) 2. HiLo Trend: DTrend,
- 3. Pvt. Evolve: Pvt high 648.45,
- 4. Pvt. Next: Pvt low 601.99,
- 5. Levels R: 796.25, 790.80, 779.82, 771.27, 648.45,
- 6. Levels S: 583.80, 537.27, 524.49, 520.26, 479.80.
Daily Benchmarks
- (Near-Term) 5 Day: 635.37 Up Trend,
- (Near-Term) 10 Day: 624.98 Up Trend,
- (Medium-Term) 20 Day: 637.08 Up Trend,
- (Medium-Term) 55 Day: 653.59 Down Trend,
- (Far-Term) 100 Day: 636.91 Up Trend,
- (Far-Term) 200 Day: 630.77 Up Trend.
Additional Metrics
- ATR: 2162,
- VOLMA: 26211336.
Overall Rating
- Near-Term: Bullish,
- Medium-Term: Bearish,
- Far-Term: Bullish.
Key Insights Summary
From a futures swing trader’s perspective, META shows a near-term countertrend recovery within a broader declining pivot structure. The rebound from 583.80 reached 648.45 before retracing toward the 10-day benchmark and the upper portion of November’s neutral zone. Price remains above the monthly center line near 615 but below the tightly grouped benchmarks around 631–637, reflecting overhead congestion rather than a confirmed trend continuation. Near-term and far-term ratings reflect the majority of their rising benchmark and pivot metrics; however, price below both long-term averages leaves the far-term bullish reading structurally mixed. The declining 55-day average and medium-term pivot downtrend retain the broader corrective character. Recent volume has faded and ATR has eased, indicating reduced participation and cooling volatility following the selloff. Weekly and yearly grids, named signal-series readings, and news catalysts are not verifiable from this image; their neutral placeholders are not confirmed directional signals. This is an equity chart assessed through a futures-style trend, volatility, and market-structure framework.
Chart Analysis ATS AI Generated: 2026-11-16 15:08 for Informational use only, not trading advice. Terms and Risk Disclosure Copyright © 2026. Algo Trading Systems LLC.