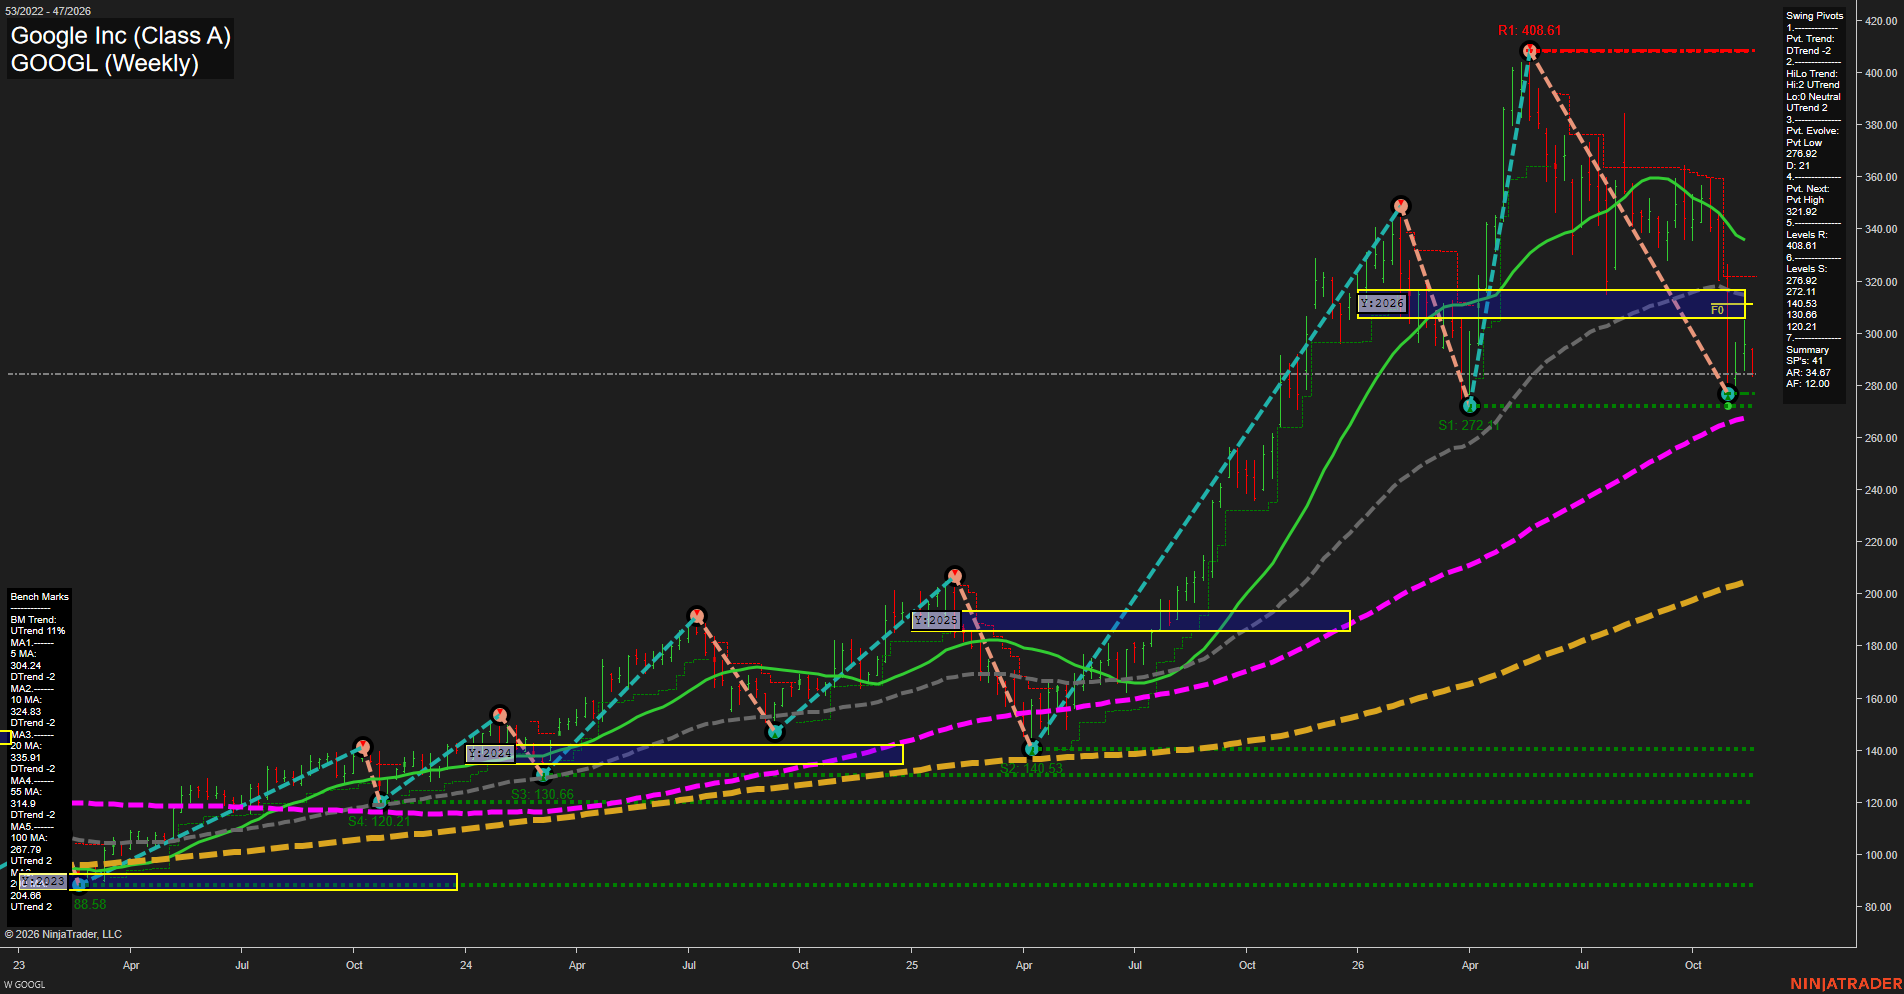
GOOGL Google Inc (Class A) Weekly Chart Analysis — After Market Close: 2026-Nov-16 15:08 CT
Price Action
- Last: Approximately 285,
- Bars: Large,
- Mom: Momentum fast to the downside.
WSFG Weekly
- Near-Term
- WSFG Current: NA%
- F0%/NTZ' Bias: Price Neutral,
- WSFG Trend: Neutral.
MSFG Month Nov
- Medium-Term
- MSFG Current: NA%
- F0%/NTZ' Bias: Price Neutral,
- MSFG Trend: Neutral.
YSFG Year 2026
- Far-Term
- YSFG Current: NA%
- F0%/NTZ' Bias: Price Neutral,
- YSFG Trend: Neutral.
Swing Pivots
- (Near-Term) 1. Pvt. Trend: DTrend,
- (Medium-Term) 2. HiLo Trend: UTrend,
- 3. Pvt. Evolve: Pvt low 276.92,
- 4. Pvt. Next: Pvt high 321.92,
- 5. Levels R: 408.61,
- 6. Levels S: 276.92, 272.11, 140.53, 130.66, 120.21.
Weekly Benchmarks
- (Near-Term) 5 Week: 304.24 Down Trend,
- (Near-Term) 10 Week: 324.83 Down Trend,
- (Medium-Term) 20 Week: 335.91 Down Trend,
- (Medium-Term) 55 Week: 314.90 Down Trend,
- (Far-Term) 100 Week: 267.79 Up Trend,
- (Far-Term) 200 Week: 204.86 Up Trend.
Overall Rating
- Near-Term: Bearish,
- Medium-Term: Bearish,
- Far-Term: Bullish.
Key Insights Summary
From a futures swing trader’s perspective, this equity chart shows a fast corrective downswing within a still-rising long-term structure. Price is approximately 30% below the 408.61 peak, beneath all four shorter benchmarks, and testing the closely grouped 276.92–272.11 pivot supports. The evolving low remains marginally above the prior 272.11 low, explaining why the medium-term HiLo classification remains UTrend despite bearish benchmark alignment. The 321.92 next-pivot threshold marks the chart’s near-term reversal reference. Rising 100- and 200-week benchmarks preserve the far-term bullish assessment, although price is approaching the 100-week average. The displayed yearly NTZ is approximately 306–317, with price below it; this is a bearish positional reading rather than the neutral placeholder above. Weekly and monthly grids and the requested USAR signals are not displayed, so their direction cannot be verified. No news or seasonal conclusions can be established from this chart alone.
Chart Analysis ATS AI Generated: 2026-11-16 15:08 for Informational use only, not trading advice. Terms and Risk Disclosure Copyright © 2026. Algo Trading Systems LLC.