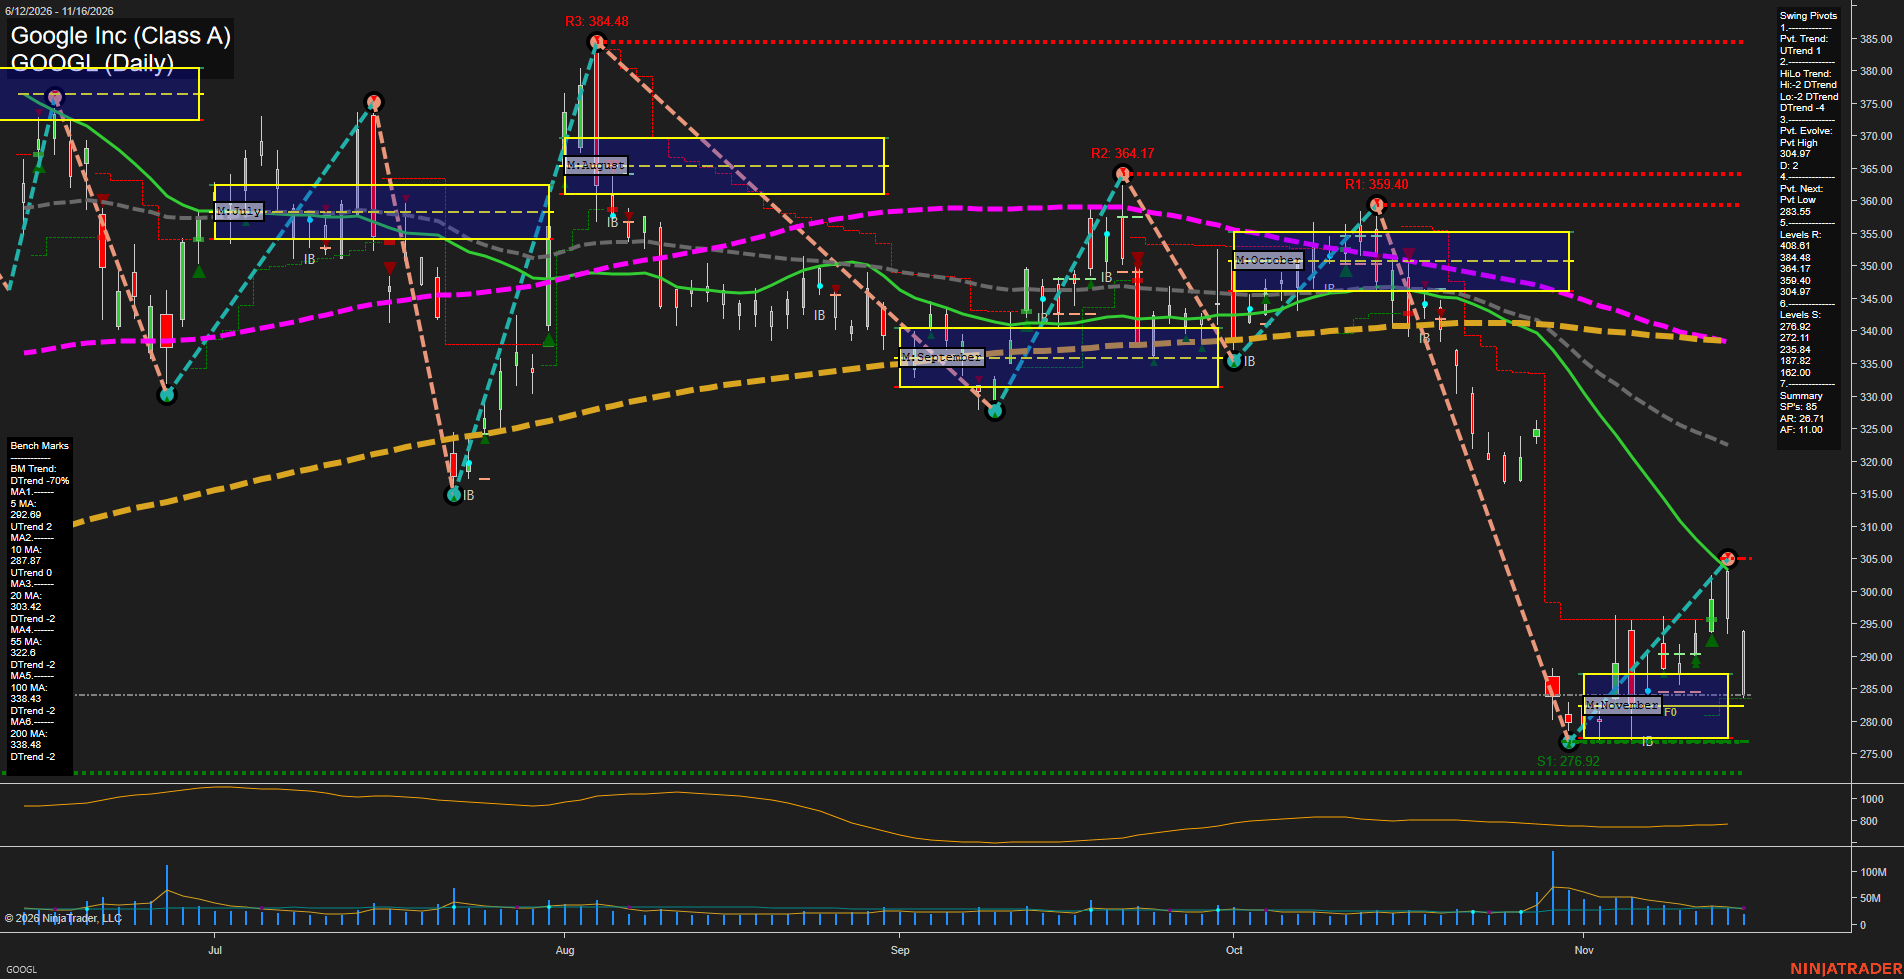
GOOGL Google Inc (Class A) Daily Chart Analysis — After Market Close: 2026-Nov-16 15:07 CT
Price Action
- Last: Approximately 284.00,
- Bars: Large,
- Mom: Fast downside momentum.
WSFG Weekly
- Near-Term
- WSFG Current: NA%
- F0%/NTZ' Bias: Price Neutral,
- WSFG Trend: Neutral.
MSFG Month Nov
- Medium-Term
- MSFG Current: NA%
- F0%/NTZ' Bias: Price Neutral,
- MSFG Trend: Neutral.
YSFG Year 2026
- Far-Term
- YSFG Current: NA%
- F0%/NTZ' Bias: Price Neutral,
- YSFG Trend: Neutral.
Swing Pivots
- (Near-Term) 1. Pvt. Trend: UTrend,
- (Medium-Term) 2. HiLo Trend: DTrend,
- 3. Pvt. Evolve: Pvt high 304.97,
- 4. Pvt. Next: Pvt low 283.55,
- 5. Levels R: 408.61, 384.48, 364.17, 359.40, 304.97,
- 6. Levels S: 276.92, 272.11, 235.84, 187.82, 162.00.
Daily Benchmarks
- (Near-Term) 5 Day: 292.69 Up Trend,
- (Near-Term) 10 Day: 287.87 Up Trend,
- (Medium-Term) 20 Day: 303.42 Down Trend,
- (Medium-Term) 55 Day: 322.60 Down Trend,
- (Far-Term) 100 Day: 338.43 Down Trend,
- (Far-Term) 200 Day: 338.48 Down Trend.
Additional Metrics
- ATR: Approximately 780 chart units,
- VOLMA: 25379774.
Overall Rating
- Near-Term: Bullish,
- Medium-Term: Bearish,
- Far-Term: Bearish.
Key Insights Summary
From a futures swing-trader perspective, this equity chart shows a short-term countertrend rebound within a broader downtrend, rather than a confirmed major reversal. The recovery from 276.92 reached 304.97 near the declining 20-day benchmark before a large bearish bar returned price to November’s neutral zone. The near-term bullish rating reflects the still-rising 5- and 10-day benchmarks and the reported pivot uptrend, but price has fallen below both averages, materially weakening that signal. The next opposite-pivot threshold is 283.55, while 276.92 and 272.11 define the nearest structural support. Declining medium- and long-term benchmarks and lower swing highs preserve the broader bearish structure. Volume expanded sharply during the late-October selloff, whereas the subsequent rebound showed less participation. Weekly and yearly grids and the named strategy signals are not visible; their neutral entries represent unavailable confirmation, not independently established trends. No news or seasonal catalyst can be verified from the chart.
Chart Analysis ATS AI Generated: 2026-11-16 15:07 for Informational use only, not trading advice. Terms and Risk Disclosure Copyright © 2026. Algo Trading Systems LLC.