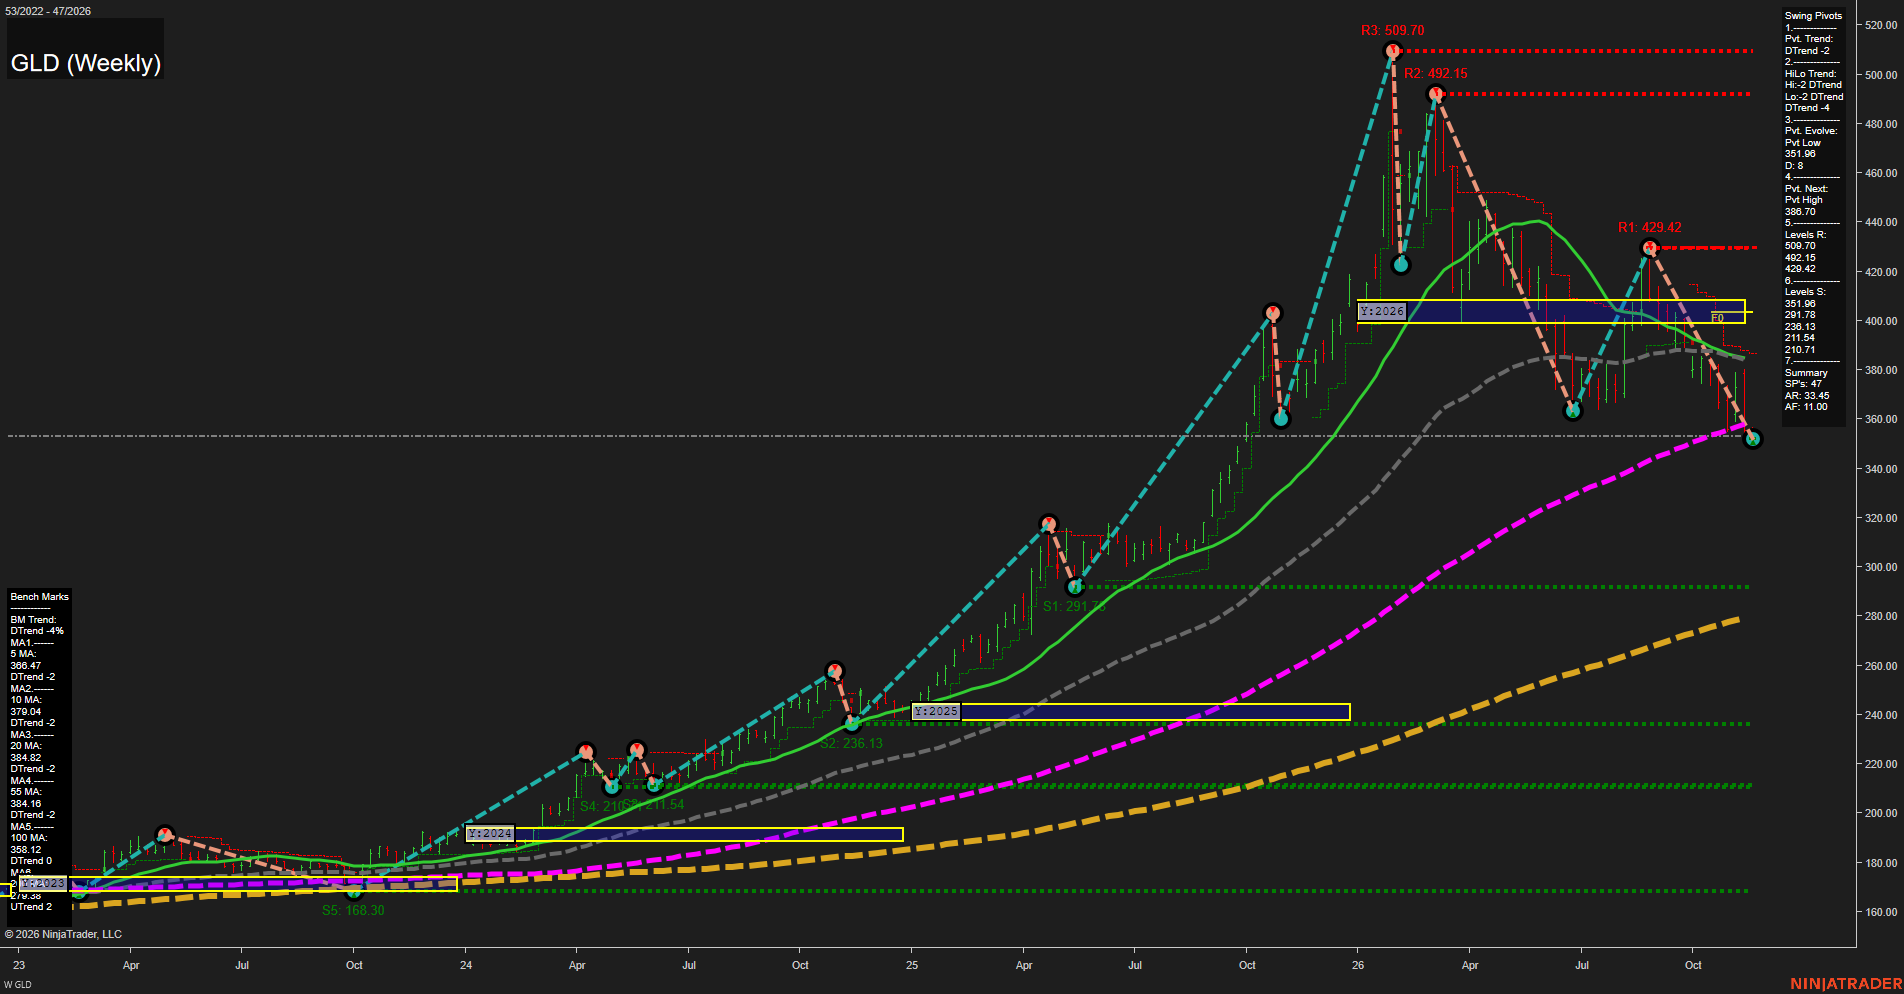
GLD SPDR Gold Shares Weekly Chart Analysis — After Market Close: 2026-Nov-16 15:07 CT
Price Action
- Last: Approximately 353,
- Bars: Large,
- Mom: Momentum fast to the downside.
WSFG Weekly
- Near-Term
- WSFG Current: NA%
- F0%/NTZ' Bias: Price Neutral,
- WSFG Trend: Neutral.
MSFG Month Nov
- Medium-Term
- MSFG Current: NA%
- F0%/NTZ' Bias: Price Neutral,
- MSFG Trend: Neutral.
YSFG Year 2026
- Far-Term
- YSFG Current: NA%
- F0%/NTZ' Bias: Price Below NTZ,
- YSFG Trend: Bearish.
Swing Pivots
- (Near-Term) 1. Pvt. Trend: DTrend,
- (Medium-Term) 2. HiLo Trend: DTrend,
- 3. Pvt. Evolve: Pvt low 351.96,
- 4. Pvt. Next: Pvt high 386.70,
- 5. Levels R: 509.70, 492.15, 429.42,
- 6. Levels S: 351.96, 291.78, 236.13, 211.54, 210.71.
Weekly Benchmarks
- (Near-Term) 5 Week: 366.47 Down Trend,
- (Near-Term) 10 Week: 379.04 Down Trend,
- (Medium-Term) 20 Week: 384.82 Down Trend,
- (Medium-Term) 55 Week: 384.16 Down Trend,
- (Far-Term) 100 Week: 358.12 Down Trend,
- (Far-Term) 200 Week: Approximately 278.58 Up Trend.
Overall Rating
- Near-Term: Bearish,
- Medium-Term: Bearish,
- Far-Term: Bearish.
Key Insights Summary
From a futures swing trader’s perspective, GLD shows a sustained corrective downswing rather than a confirmed bullish reversal. Successively lower highs at 509.70, 492.15 and 429.42 accompany falling pivot lows, with price testing 351.96 support. The latest decline has moved beneath the approximately 358.12 benchmark, while the falling 5- through 55-week averages reinforce bearish near- and medium-term alignment. The 386.70 next-pivot threshold is a structural reference, not an established reversal. Price remains well below the 2026 yearly neutral zone around 400–409, confirming weakness against the annual reference. Far-term evidence leans bearish, although the rising 200-week average preserves an underlying major-trend counterweight; the 100-week slope is approximately flat to marginally down. Weekly and monthly grids and the named recent signal studies are not displayed, so their neutral entries represent unavailable confirmation rather than observed balance. These are GLD share-price levels, not gold futures contract prices; news and seasonal drivers cannot be established from this chart alone.
Chart Analysis ATS AI Generated: 2026-11-16 15:07 for Informational use only, not trading advice. Terms and Risk Disclosure Copyright © 2026. Algo Trading Systems LLC.