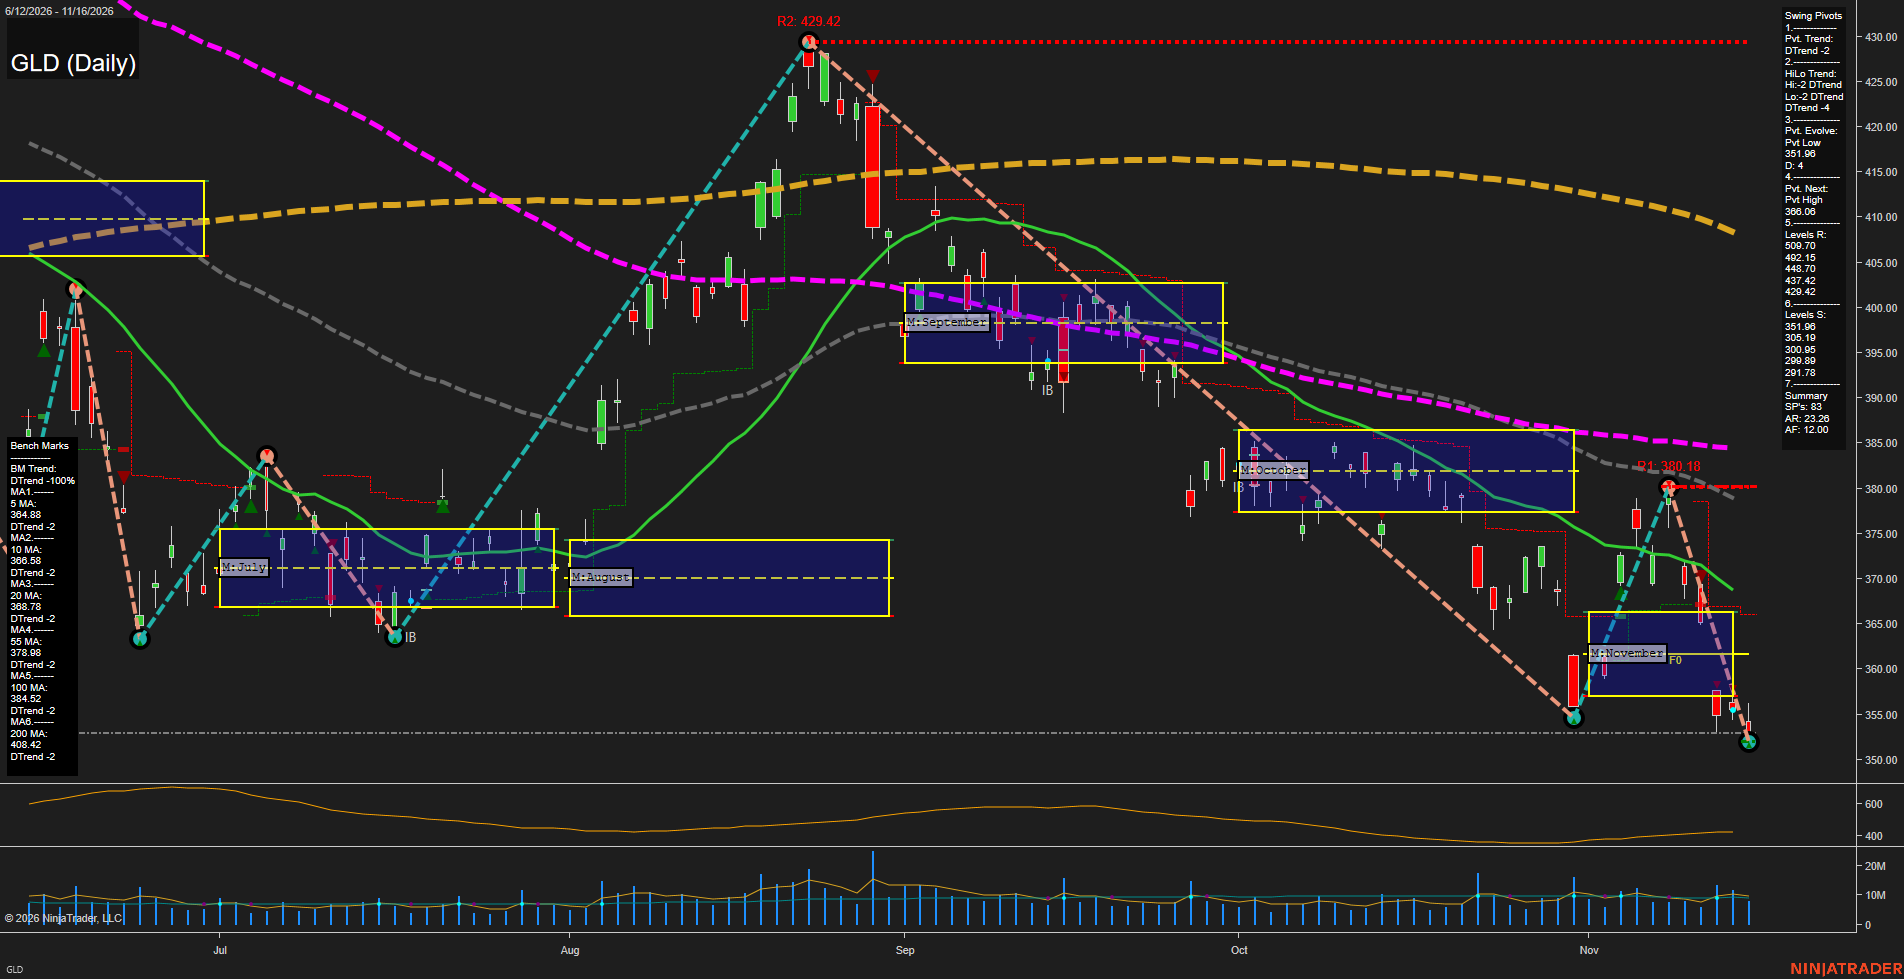
GLD SPDR Gold Shares Daily Chart Analysis — After Market Close: 2026-Nov-16 15:07 CT
Price Action
- Last: approximately 353,
- Bars: Medium,
- Mom: Momentum fast to the downside.
WSFG Weekly
- Near-Term
- WSFG Current: NA%
- F0%/NTZ' Bias: Price Neutral,
- WSFG Trend: Neutral.
MSFG Month Nov
- Medium-Term
- MSFG Current: NA%
- F0%/NTZ' Bias: Price Bearish below F0% and NTZ,
- MSFG Trend: Bearish.
YSFG Year 2026
- Far-Term
- YSFG Current: NA%
- F0%/NTZ' Bias: Price Neutral,
- YSFG Trend: Neutral.
Swing Pivots
- (Near-Term) 1. Pvt. Trend: DTrend,
- (Medium-Term) 2. HiLo Trend: DTrend,
- 3. Pvt. Evolve: Pvt low 351.96,
- 4. Pvt. Next: Pvt high 366.06,
- 5. Levels R: 509.70, 492.15, 448.70, 437.42, 429.42,
- 6. Levels S: 351.96, 305.19, 300.95, 299.89, 291.78.
Daily Benchmarks
- (Near-Term) 5 Day: 364.88 Down Trend,
- (Near-Term) 10 Day: 366.58 Down Trend,
- (Medium-Term) 20 Day: 368.78 Down Trend,
- (Medium-Term) 55 Day: 378.98 Down Trend,
- (Far-Term) 100 Day: 384.52 Down Trend,
- (Far-Term) 200 Day: 408.42 Down Trend.
Additional Metrics
- ATR: 159,
- VOLMA: 7207880.
Overall Rating
- Near-Term: Bearish,
- Medium-Term: Bearish,
- Far-Term: Bearish.
Key Insights Summary
From a futures swing trader’s perspective, GLD reflects a broad bearish gold-price structure, although these are ETF levels rather than futures contract prices. The rebound to 380.18 failed, followed by renewed selling beneath the November NTZ and a developing pivot low at 351.96. Lower pivot highs and lows, price below all six declining benchmarks, and the monthly grid breakdown collectively favor a trend-continuation interpretation over a confirmed reversal. The 366.06 next-pivot threshold and recent 380.18 swing high define nearby overhead structure, distinct from the resistance levels listed in the summary. Weekly and yearly grids are not visible; their neutral entries represent unavailable confirmation rather than established balance. Named trade-signal readings, news catalysts, and seasonal evidence are not displayed. ATR and VOLMA values are supplied figures rather than independently verified panel readings.
Chart Analysis ATS AI Generated: 2026-11-16 15:07 for Informational use only, not trading advice. Terms and Risk Disclosure Copyright © 2026. Algo Trading Systems LLC.