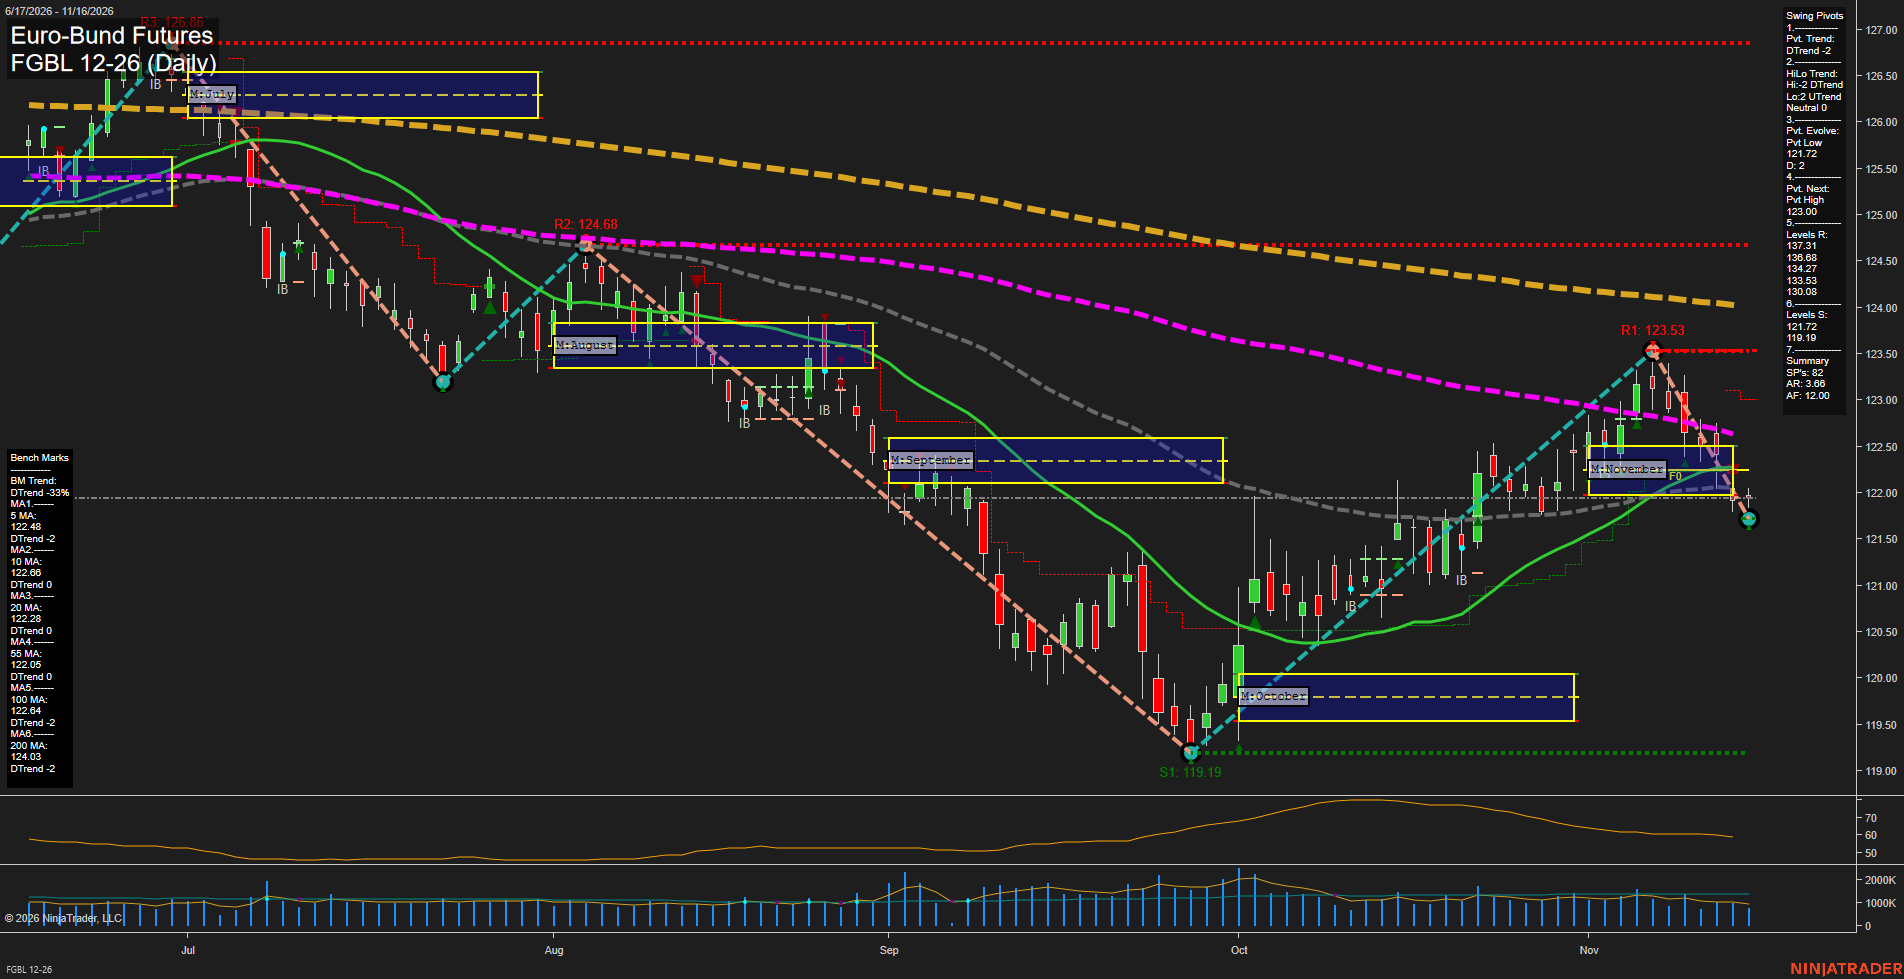
FGBL Euro-Bund Futures Daily Chart Analysis — After Market Close: 2026-Nov-16 15:06 CT
Price Action
- Last: Approximately 121.95,
- Bars: Small,
- Mom: Momentum fast.
WSFG Weekly
- Near-Term
- WSFG Current: -4%
- F0%/NTZ' Bias: Price Below,
- WSFG Trend: Down.
MSFG Month Nov
- Medium-Term
- MSFG Current: -13%
- F0%/NTZ' Bias: Price Below,
- MSFG Trend: Down.
YSFG Year 2026
- Far-Term
- YSFG Current: -33%
- F0%/NTZ' Bias: Price Below,
- YSFG Trend: Down.
Swing Pivots
- (Near-Term) 1. Pvt. Trend: DTrend,
- (Medium-Term) 2. HiLo Trend: Neutral,
- 3. Pvt. Evolve: Pvt low 121.72,
- 4. Pvt. Next: Pvt high 123.00,
- 5. Levels R: 137.31, 136.68, 134.27, 133.53, 130.08,
- 6. Levels S: 121.72, 119.19.
Daily Benchmarks
- (Near-Term) 5 Day: 122.48 Down Trend,
- (Near-Term) 10 Day: 122.66 Down Trend,
- (Medium-Term) 20 Day: 122.28 Down Trend,
- (Medium-Term) 55 Day: 122.05 Down Trend,
- (Far-Term) 100 Day: 122.64 Down Trend,
- (Far-Term) 200 Day: 124.03 Down Trend.
Additional Metrics
Recent Trade Signals
- 16 Nov 2026: Short FGBL 12-26 @ 121.82 Signals.USAR-WSFG
- 13 Nov 2026: Short FGBL 12-26 @ 121.93 Signals.USAR-MSFG
- 10 Nov 2026: Short FGBL 12-26 @ 122.68 Signals.USAR.TR120
Overall Rating
- Near-Term: Bearish,
- Medium-Term: Bearish,
- Far-Term: Bearish.
Key Insights Summary
The October–November recovery from 119.19 stalled at the visible 123.53 swing high, followed by a sharp downswing to an evolving low of 121.72. The latest small bar suggests a pause after that decline rather than an established reversal. Price is below all six daily benchmarks and beneath the weekly and monthly neutral zones, aligning with the recent short signals. The medium-term pivot structure remains mixed, with lower highs but higher lows producing a neutral HiLo reading; nevertheless, the broader technical balance is bearish. Nearby chart resistance includes 122.05–122.66 and the 123.00 pivot-reversal threshold, followed by 123.53. Support is marked at 121.72 and 119.19. The elevated resistance values in the pivot summary are historical levels, distinct from these nearby visible barriers. Falling longer-term averages suggest the recent rally remained a countertrend recovery. News catalysts and seasonal effects cannot be established from this chart alone.
Chart Analysis ATS AI Generated: 2026-11-16 15:06 for Informational use only, not trading advice. Terms and Risk Disclosure Copyright © 2026. Algo Trading Systems LLC.