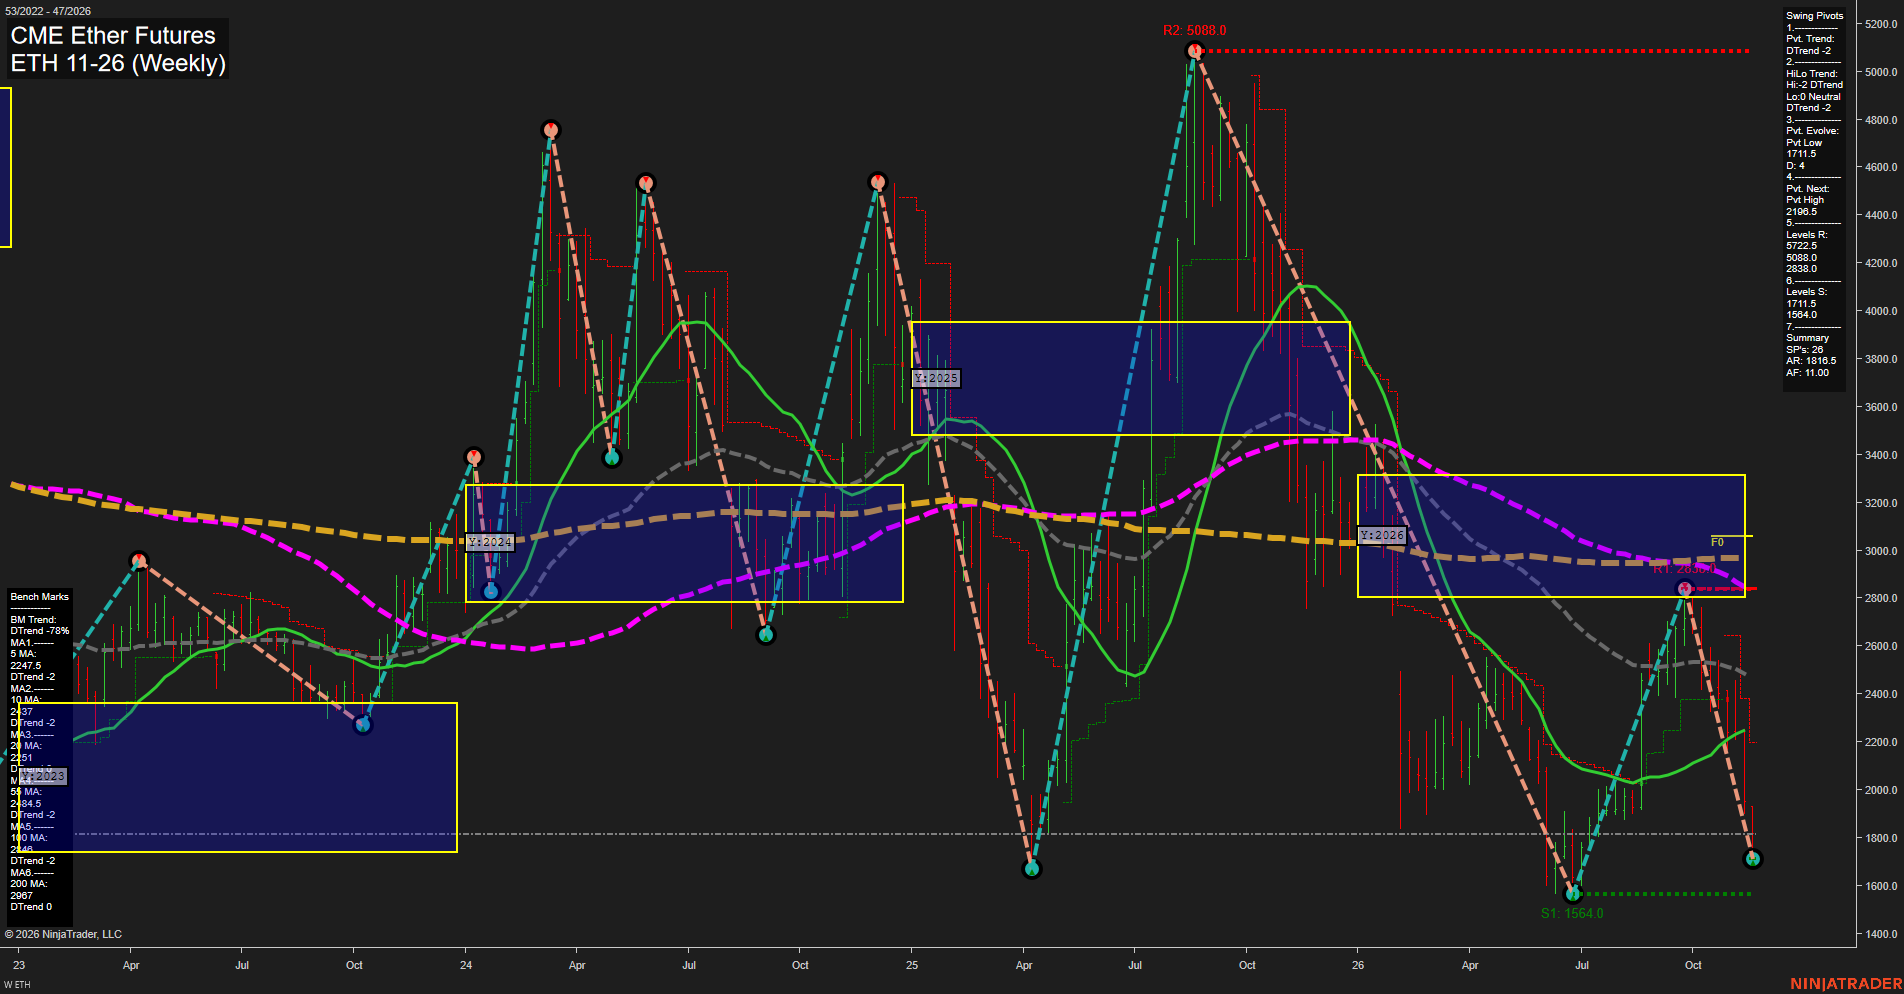
ETH CME Ether Futures Weekly Chart Analysis — After Market Close: 2026-Nov-16 15:05 CT
Price Action
- Last: Approximately 1807,
- Bars: Large,
- Mom: Momentum fast to the downside.
WSFG Weekly
- Near-Term
- WSFG Current: 4%
- F0%/NTZ' Bias: Price Above,
- WSFG Trend: Up.
MSFG Month Nov
- Medium-Term
- MSFG Current: -73%
- F0%/NTZ' Bias: Price Below,
- MSFG Trend: Down.
YSFG Year 2026
- Far-Term
- YSFG Current: -48%
- F0%/NTZ' Bias: Price Below,
- YSFG Trend: Down.
Swing Pivots
- (Near-Term) 1. Pvt. Trend: DTrend,
- (Medium-Term) 2. HiLo Trend: DTrend,
- 3. Pvt. Evolve: Pvt low 1711.5,
- 4. Pvt. Next: Pvt high 2196.5,
- 5. Levels R: 5722.5, 5088.0, 2838.0,
- 6. Levels S: 1711.5, 1564.0.
Weekly Benchmarks
- (Near-Term) 5 Week: 2247.5 Down Trend,
- (Near-Term) 10 Week: Approximately 2337 Down Trend,
- (Medium-Term) 20 Week: Approximately 2251 Up Trend,
- (Medium-Term) 55 Week: Approximately 2484.5 Down Trend,
- (Far-Term) 100 Week: Approximately 2848 Down Trend,
- (Far-Term) 200 Week: Approximately 2967 Down Trend.
Recent Trade Signals
- 16 Nov 2026: Short ETH 11-26 @ 1807 Signals.USAR-WSFG
Overall Rating
- Near-Term: Bearish,
- Medium-Term: Bearish,
- Far-Term: Bearish.
Key Insights Summary
The weekly structure reflects a renewed bearish swing after the rebound to 2838 failed beneath the yearly neutral zone. Large downside bars, a developing pivot low at 1711.5, and price below all six benchmarks indicate selling pressure across time horizons. The weekly grid's positive reading is a local countertrend exception rather than confirmation of a broader reversal; declining near-term benchmarks, the downward pivot trend, and the latest short signal dominate the near-term assessment. Medium-term conditions remain bearish despite the rising 20-week average, which lags the recent selloff. Support is concentrated at 1711.5 and the prior 1564 low, while 2196.5 is the listed opposite-pivot reversal threshold. Far-term weakness remains consistent with declining longer-term benchmarks and price below the yearly neutral zone. The chart does not establish a news catalyst or seasonal driver.
Chart Analysis ATS AI Generated: 2026-11-16 15:06 for Informational use only, not trading advice. Terms and Risk Disclosure Copyright © 2026. Algo Trading Systems LLC.