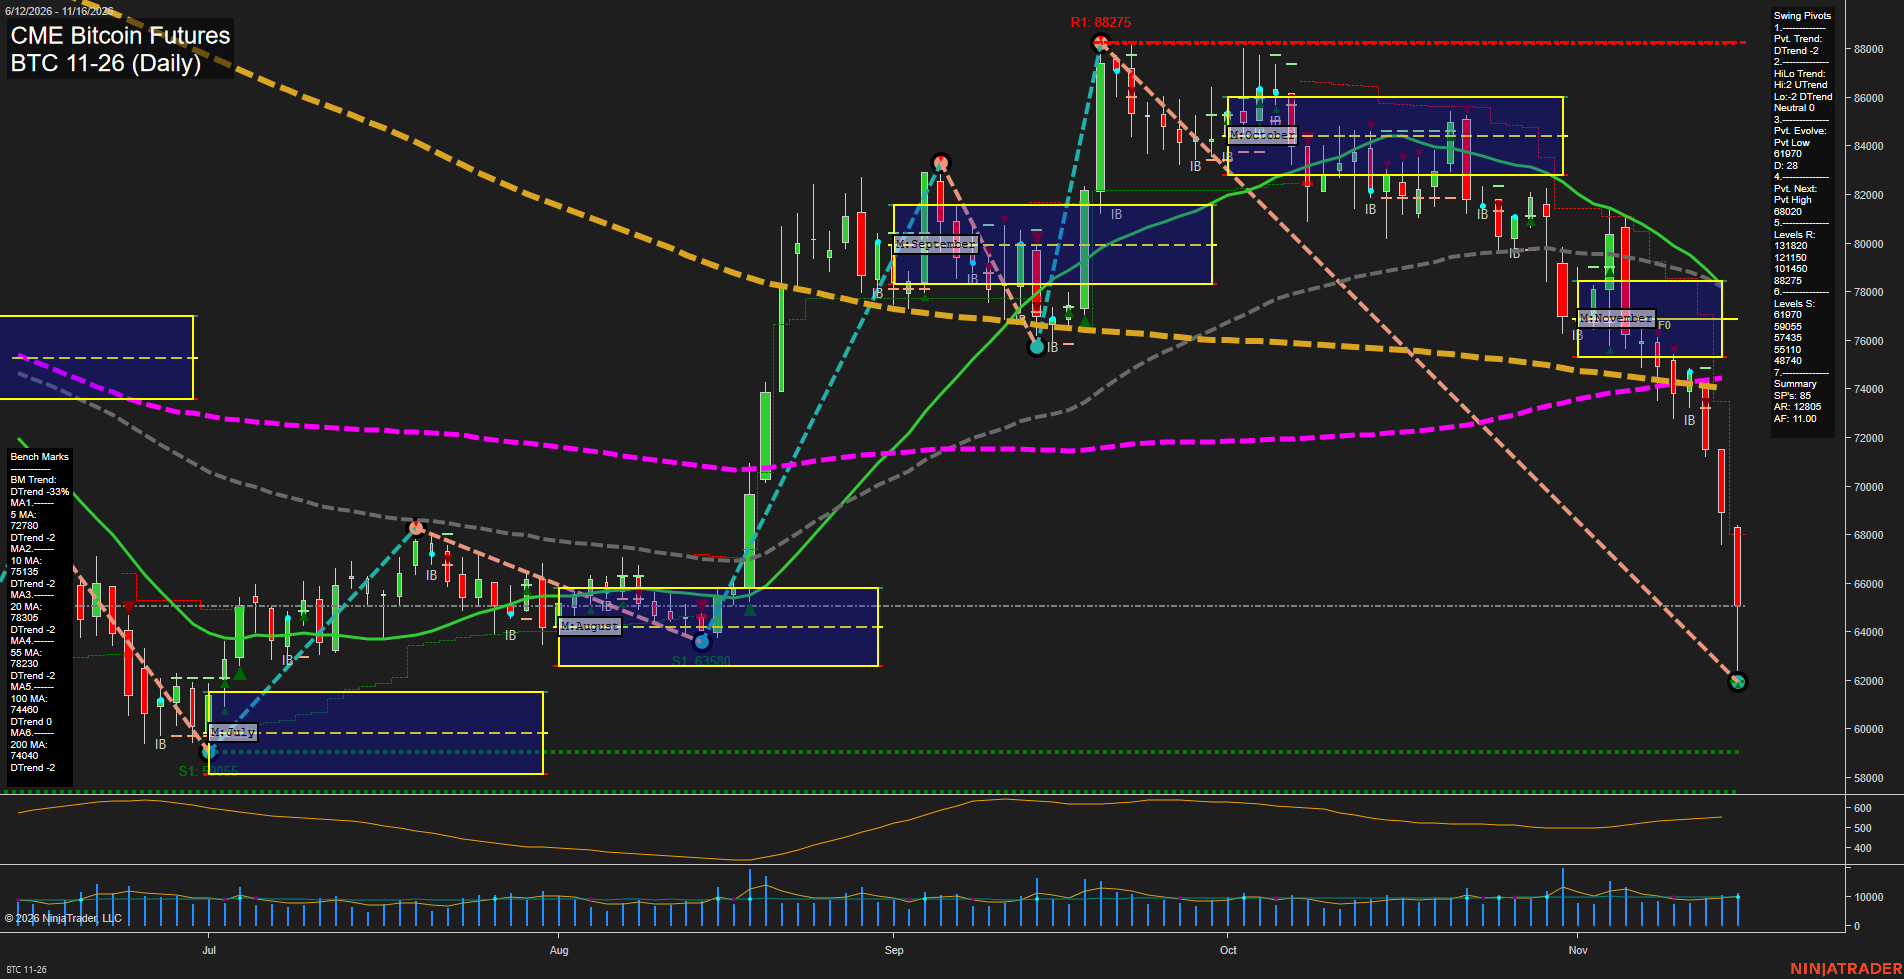
BTC CME Bitcoin Futures Daily Chart Analysis — After Market Close: 2026-Nov-16 15:03 CT
Price Action
- Last: approximately 65000,
- Bars: Large,
- Mom: Momentum fast.
WSFG Weekly
- Near-Term
- WSFG Current: 5%
- F0%/NTZ' Bias: Price Above,
- WSFG Trend: Up.
MSFG Month Nov
- Medium-Term
- MSFG Current: -88%
- F0%/NTZ' Bias: Price Below,
- MSFG Trend: Down.
YSFG Year 2026
- Far-Term
- YSFG Current: -91%
- F0%/NTZ' Bias: Price Below,
- YSFG Trend: Down.
Swing Pivots
- (Near-Term) 1. Pvt. Trend: DTrend,
- (Medium-Term) 2. HiLo Trend: Neutral, higher highs versus lower lows,
- 3. Pvt. Evolve: Pvt low 61970,
- 4. Pvt. Next: Pvt high 68020,
- 5. Levels R: 131820, 121150, 101450, 88275,
- 6. Levels S: 61970, 59055, 57435, 55110, 48740.
Daily Benchmarks
- (Near-Term) 5 Day: 72780 Down Trend,
- (Near-Term) 10 Day: 75135 Down Trend,
- (Medium-Term) 20 Day: 78035 Down Trend,
- (Medium-Term) 55 Day: 78230 Down Trend,
- (Far-Term) 100 Day: 74460 Down Trend,
- (Far-Term) 200 Day: 74040 Down Trend.
Additional Metrics
Recent Trade Signals
- 16 Nov 2026: Short BTC 11-26 @ 64475 Signals.USAR-WSFG
- 09 Nov 2026: Short BTC 11-26 @ 74740 Signals.USAR-MSFG
Overall Rating
- Near-Term: Bearish,
- Medium-Term: Bearish,
- Far-Term: Bearish.
Key Insights Summary
From a futures swing-trading perspective, the dominant feature is an accelerating downside continuation from the 88275 swing high. Large bearish candles have driven price beneath November’s NTZ and all six daily benchmarks. The latest bar shows a substantial lower wick toward 61970, indicating rejection of the session lows, but not a confirmed trend reversal. The next-pivot threshold is 68020; the evolving low remains 61970, with lower support at 59055 and 57435. Weekly grid strength conflicts with the bearish pivot trend, declining near-term averages and recent short signals, leaving the near-term balance bearish. Medium-term HiLo structure is mixed rather than uniformly bearish, but monthly weakness and declining 20- and 55-day averages dominate. Far-term conditions remain bearish beneath both long-term benchmarks and the yearly grid reference. The chart alone does not establish a news catalyst or seasonal explanation.
Chart Analysis ATS AI Generated: 2026-11-16 15:03 for Informational use only, not trading advice. Terms and Risk Disclosure Copyright © 2026. Algo Trading Systems LLC.