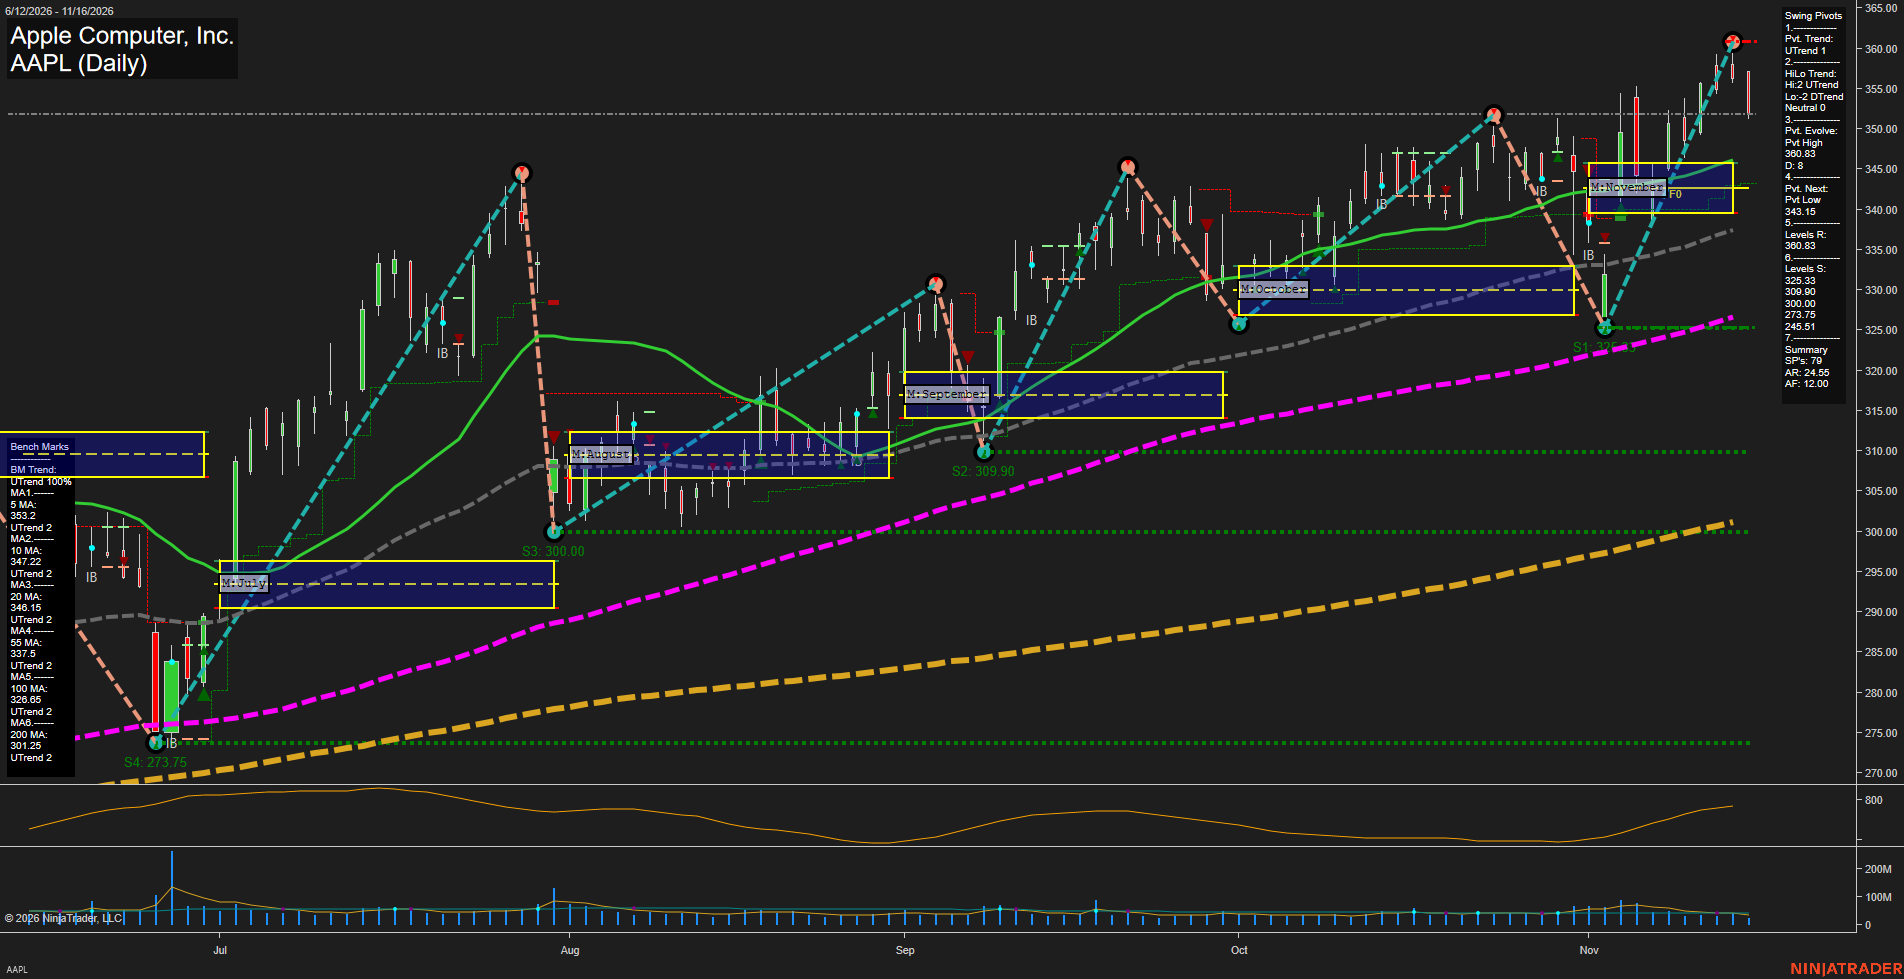
AAPL Apple Computer; Inc. Daily Chart Analysis — After Market Close: 2026-Nov-16 15:02 CT
Price Action
- Last: approximately 352.00,
- Bars: Large,
- Mom: Momentum fast.
WSFG Weekly
- Near-Term
- WSFG Current: NA%
- F0%/NTZ' Bias: Price Neutral,
- WSFG Trend: Neutral.
MSFG Month Nov
- Medium-Term
- MSFG Current: NA%
- F0%/NTZ' Bias: Price Neutral,
- MSFG Trend: Neutral.
YSFG Year 2026
- Far-Term
- YSFG Current: NA%
- F0%/NTZ' Bias: Price Neutral,
- YSFG Trend: Neutral.
Swing Pivots
- (Near-Term) 1. Pvt. Trend: UTrend,
- (Medium-Term) 2. HiLo Trend: Neutral,
- 3. Pvt. Evolve: Pvt high 360.83,
- 4. Pvt. Next: Pvt low 343.15,
- 5. Levels R: 360.83,
- 6. Levels S: 325.33, 309.90, 300.00, 273.75, 245.51.
Daily Benchmarks
- (Near-Term) 5 Day: 353.20 Up Trend,
- (Near-Term) 10 Day: 347.22 Up Trend,
- (Medium-Term) 20 Day: 346.15 Up Trend,
- (Medium-Term) 55 Day: 337.50 Up Trend,
- (Far-Term) 100 Day: 326.65 Up Trend,
- (Far-Term) 200 Day: 301.25 Up Trend.
Additional Metrics
- ATR: 520,
- VOLMA: 60967488.
Overall Rating
- Near-Term: Bullish,
- Medium-Term: Bullish,
- Far-Term: Bullish.
Key Insights Summary
From a futures swing trader’s perspective, this equity chart shows a bullish directional regime with a sharp countertrend pullback from 360.83. Price is below the rising five-day benchmark but remains above the other five rising benchmarks, indicating short-term momentum cooling rather than a confirmed broader reversal. The pivot summary reports an upward near-term trend but neutral medium-term structure because high pivots are rising while low pivots are falling. The 343.15 next-pivot threshold is distinct from established swing support at 325.33. November’s visible monthly neutral zone spans approximately 339–346; price remains above it, a bullish positional observation despite the neutral grid classifications above. Rising ATR indicates expanding daily ranges, making the latest retreat meaningful in volatility terms. ATR is reproduced in the supplied chart units, not interpreted as $520. Weekly and yearly grids and the named strategy signals are not visible; news and seasonal drivers cannot be established from this chart. These observations concern AAPL shares, not a futures contract.
Chart Analysis ATS AI Generated: 2026-11-16 15:02 for Informational use only, not trading advice. Terms and Risk Disclosure Copyright © 2026. Algo Trading Systems LLC.