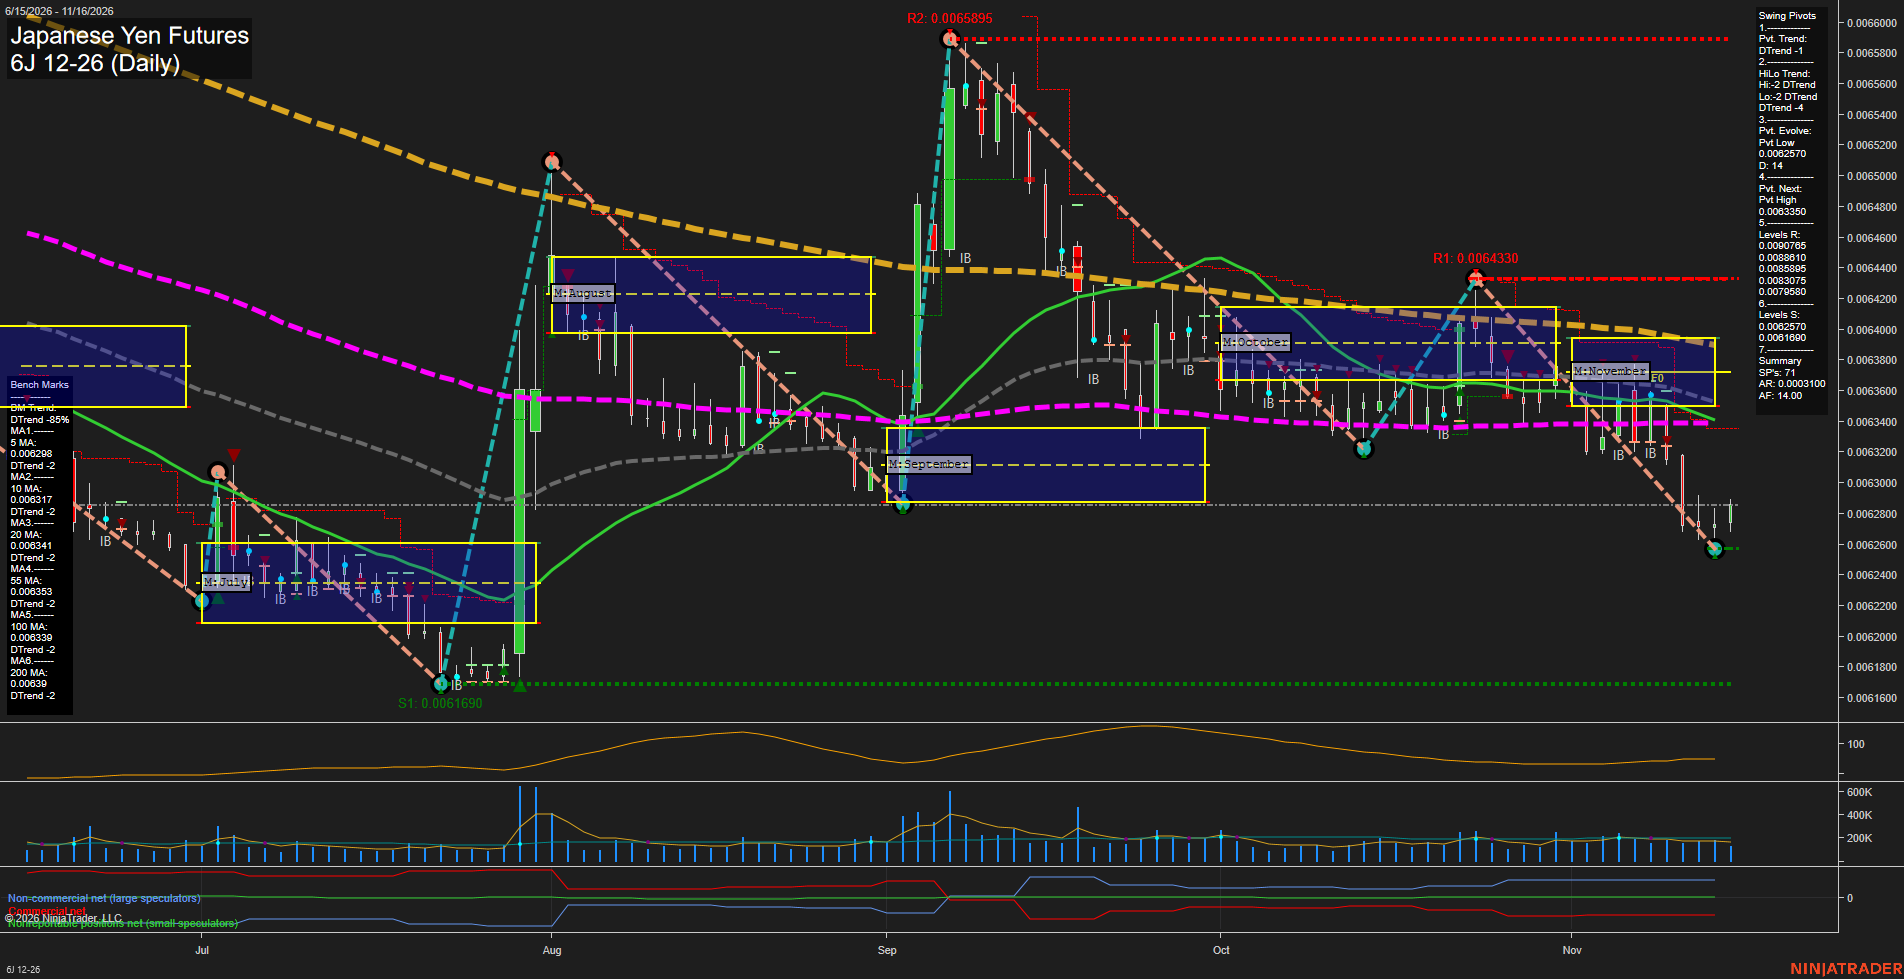
6J Japanese Yen Futures Daily Chart Analysis — After Market Close: 2026-Nov-16 15:01 CT
Price Action
- Last: approximately 0.0062850,
- Bars: Small,
- Mom: Momentum slow.
WSFG Weekly
- Near-Term
- WSFG Current: 12%
- F0%/NTZ' Bias: Price Above,
- WSFG Trend: Up.
MSFG Month Nov
- Medium-Term
- MSFG Current: -40%
- F0%/NTZ' Bias: Price Below,
- MSFG Trend: Down.
YSFG Year 2026
- Far-Term
- YSFG Current: -26%
- F0%/NTZ' Bias: Price Below,
- YSFG Trend: Down.
Swing Pivots
- (Near-Term) 1. Pvt. Trend: DTrend,
- (Medium-Term) 2. HiLo Trend: DTrend,
- 3. Pvt. Evolve: Pvt low 0.0062570,
- 4. Pvt. Next: Pvt high 0.0063350,
- 5. Levels R: 0.0090765, 0.0088610, 0.0085895, 0.0083075, 0.0079580,
- 6. Levels S: 0.0062570, 0.0061690.
Daily Benchmarks
- (Near-Term) 5 Day: 0.006298 Down Trend,
- (Near-Term) 10 Day: 0.006317 Down Trend,
- (Medium-Term) 20 Day: 0.006341 Down Trend,
- (Medium-Term) 55 Day: 0.006353 Down Trend,
- (Far-Term) 100 Day: 0.006339 Down Trend,
- (Far-Term) 200 Day: 0.006390 Down Trend.
Additional Metrics
Recent Trade Signals
- 16 Nov 2026: Long 6J 12-26 @ 0.006282 Signals.USAR-WSFG
- 10 Nov 2026: Short 6J 12-26 @ 0.0063185 Signals.USAR.TR120
Overall Rating
- Near-Term: Bearish,
- Medium-Term: Bearish,
- Far-Term: Bearish.
Key Insights Summary
The yen remains in a broader downswing, with lower pivot highs and lows, price beneath all six declining benchmarks, and negative monthly and yearly grid readings. The latest small-bar rebound from 0.0062570 represents a countertrend bounce rather than a confirmed trend reversal. Weekly grid strength and the new WSFG long signal contrast with the earlier TR120 short signal, showing improving short-horizon conditions within a bearish structure. The next pivot reversal threshold is 0.0063350, near the clustered 20-, 55- and 100-day benchmarks. Visible swing highs at 0.0064330 and 0.0065895 provide closer overhead reference points than the distant resistance levels listed in the summary. Support remains at 0.0062570, followed by 0.0061690. Recent bars suggest slowing downside momentum, but the chart does not yet establish a sustained higher-low recovery. News and seasonal catalysts cannot be verified from the chart alone.
Chart Analysis ATS AI Generated: 2026-11-16 15:01 for Informational use only, not trading advice. Terms and Risk Disclosure Copyright © 2026. Algo Trading Systems LLC.