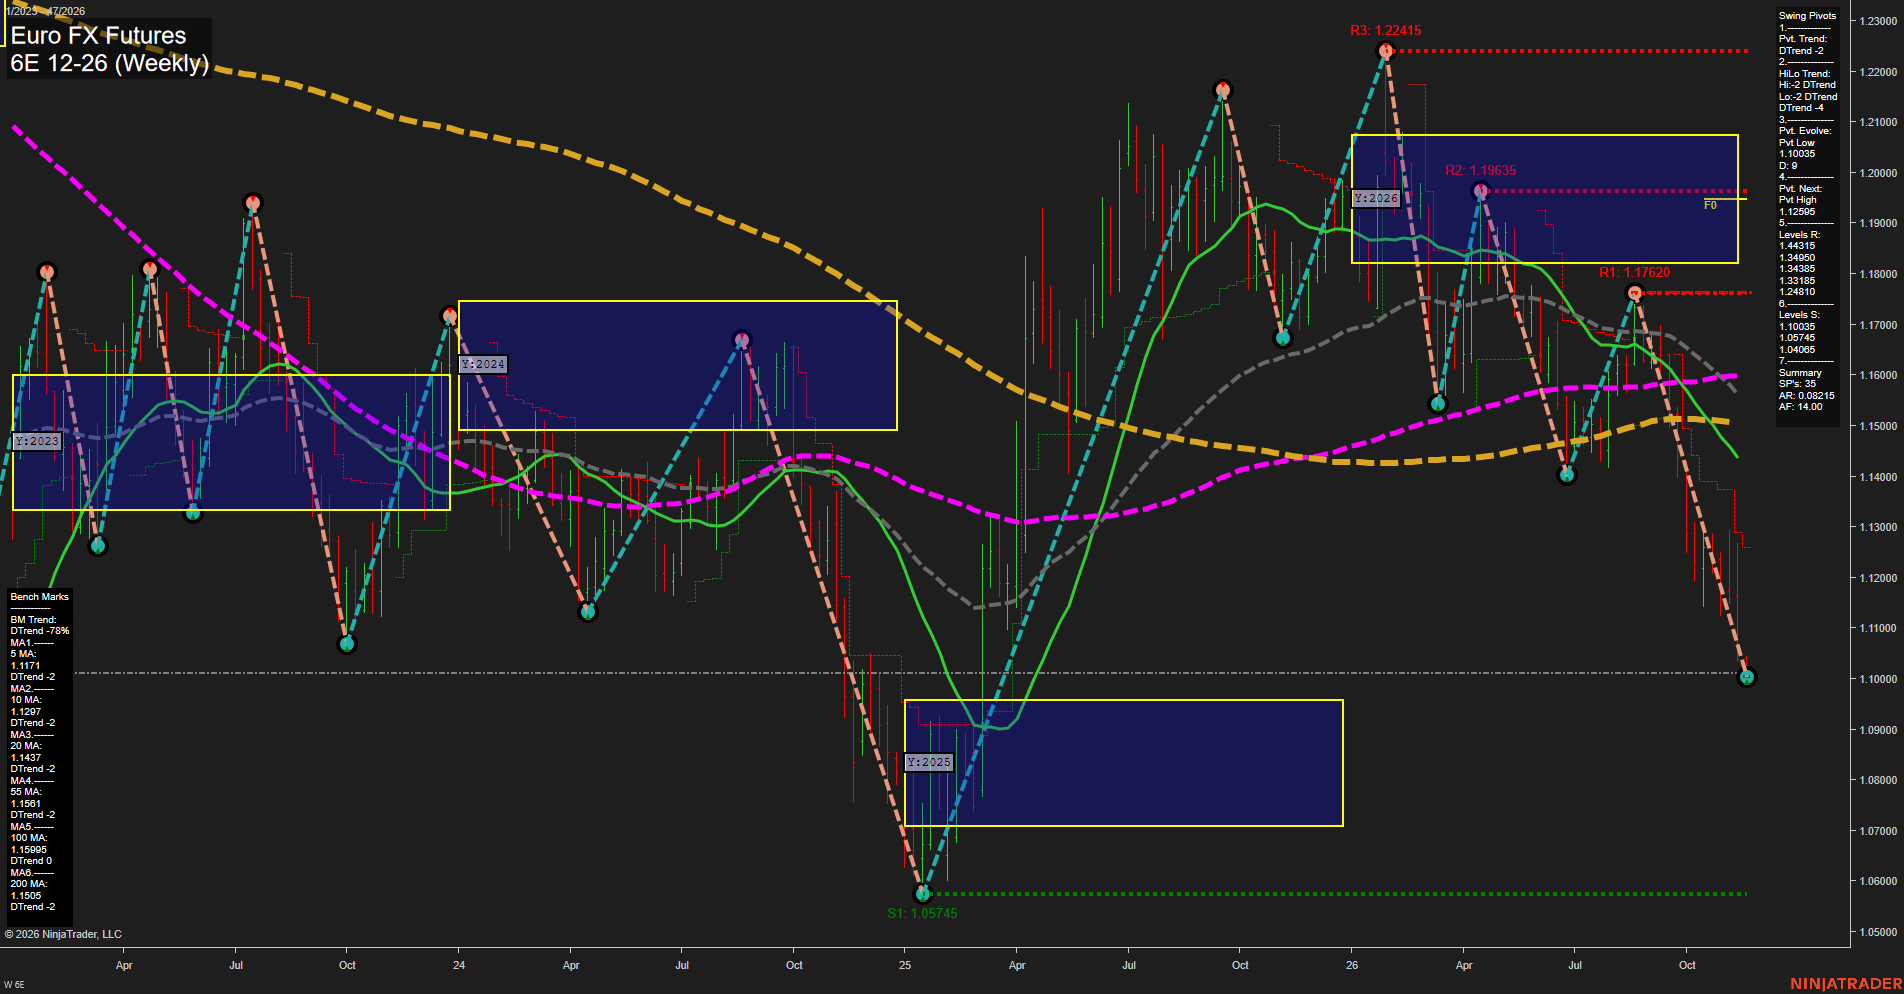
6E Euro FX Futures Weekly Chart Analysis — After Market Close: 2026-Nov-16 15:01 CT
Price Action
- Last: Approximately 1.1011,
- Bars: Large,
- Mom: Momentum fast.
WSFG Weekly
- Near-Term
- WSFG Current: -21%
- F0%/NTZ' Bias: Price Below,
- WSFG Trend: Down.
MSFG Month Nov
- Medium-Term
- MSFG Current: -68%
- F0%/NTZ' Bias: Price Below,
- MSFG Trend: Down.
YSFG Year 2026
- Far-Term
- YSFG Current: -74%
- F0%/NTZ' Bias: Price Below,
- YSFG Trend: Down.
Swing Pivots
- (Near-Term) 1. Pvt. Trend: DTrend,
- (Medium-Term) 2. HiLo Trend: DTrend,
- 3. Pvt. Evolve: Pvt low 1.10035,
- 4. Pvt. Next: Pvt high 1.12595,
- 5. Levels R: 1.44315, 1.34950, 1.34385, 1.33185, 1.24810,
- 6. Levels S: 1.10035, 1.05745, 1.04065.
Weekly Benchmarks
- (Near-Term) 5 Week: 1.1171 Down Trend,
- (Near-Term) 10 Week: 1.1297 Down Trend,
- (Medium-Term) 20 Week: 1.1437 Down Trend,
- (Medium-Term) 55 Week: 1.1561 Down Trend,
- (Far-Term) 100 Week: 1.15995 Down Trend,
- (Far-Term) 200 Week: 1.1505 Down Trend.
Recent Trade Signals
- 16 Nov 2026: Short 6E 12-26 @ 1.1011 Signals.USAR-WSFG
- 11 Nov 2026: Short 6E 12-26 @ 1.1147 Signals.USAR-MSFG
- 10 Nov 2026: Short 6E 12-26 @ 1.11675 Signals.USAR.TR120
Overall Rating
- Near-Term: Bearish,
- Medium-Term: Bearish,
- Far-Term: Bearish.
Key Insights Summary
From a futures swing-trading perspective, the dominant feature is downside trend continuation rather than consolidation. Successively lower swing highs at 1.22415, 1.19635 and 1.17620 precede the sharp decline toward the evolving 1.10035 pivot low. Price is below every weekly benchmark and all three session-grid neutral zones, while recent near- and medium-term short signals reinforce the bearish alignment. The 1.10035 support is immediately relevant, followed by 1.05745 and 1.04065 in the pivot summary. The next opposite-pivot reversal threshold is 1.12595; an upward reaction alone would not establish a medium-term trend reversal. The 100-week benchmark carries a DTrend 0 reading, indicating less directional persistence than the other declining benchmarks. The summary resistance list contains distant historical levels, distinct from the nearer swing highs labeled on the chart. No TR720 signal or news and seasonal evidence is supplied, so the far-term bearish rating rests on the yearly grid and benchmark structure.
Chart Analysis ATS AI Generated: 2026-11-16 15:01 for Informational use only, not trading advice. Terms and Risk Disclosure Copyright © 2026. Algo Trading Systems LLC.