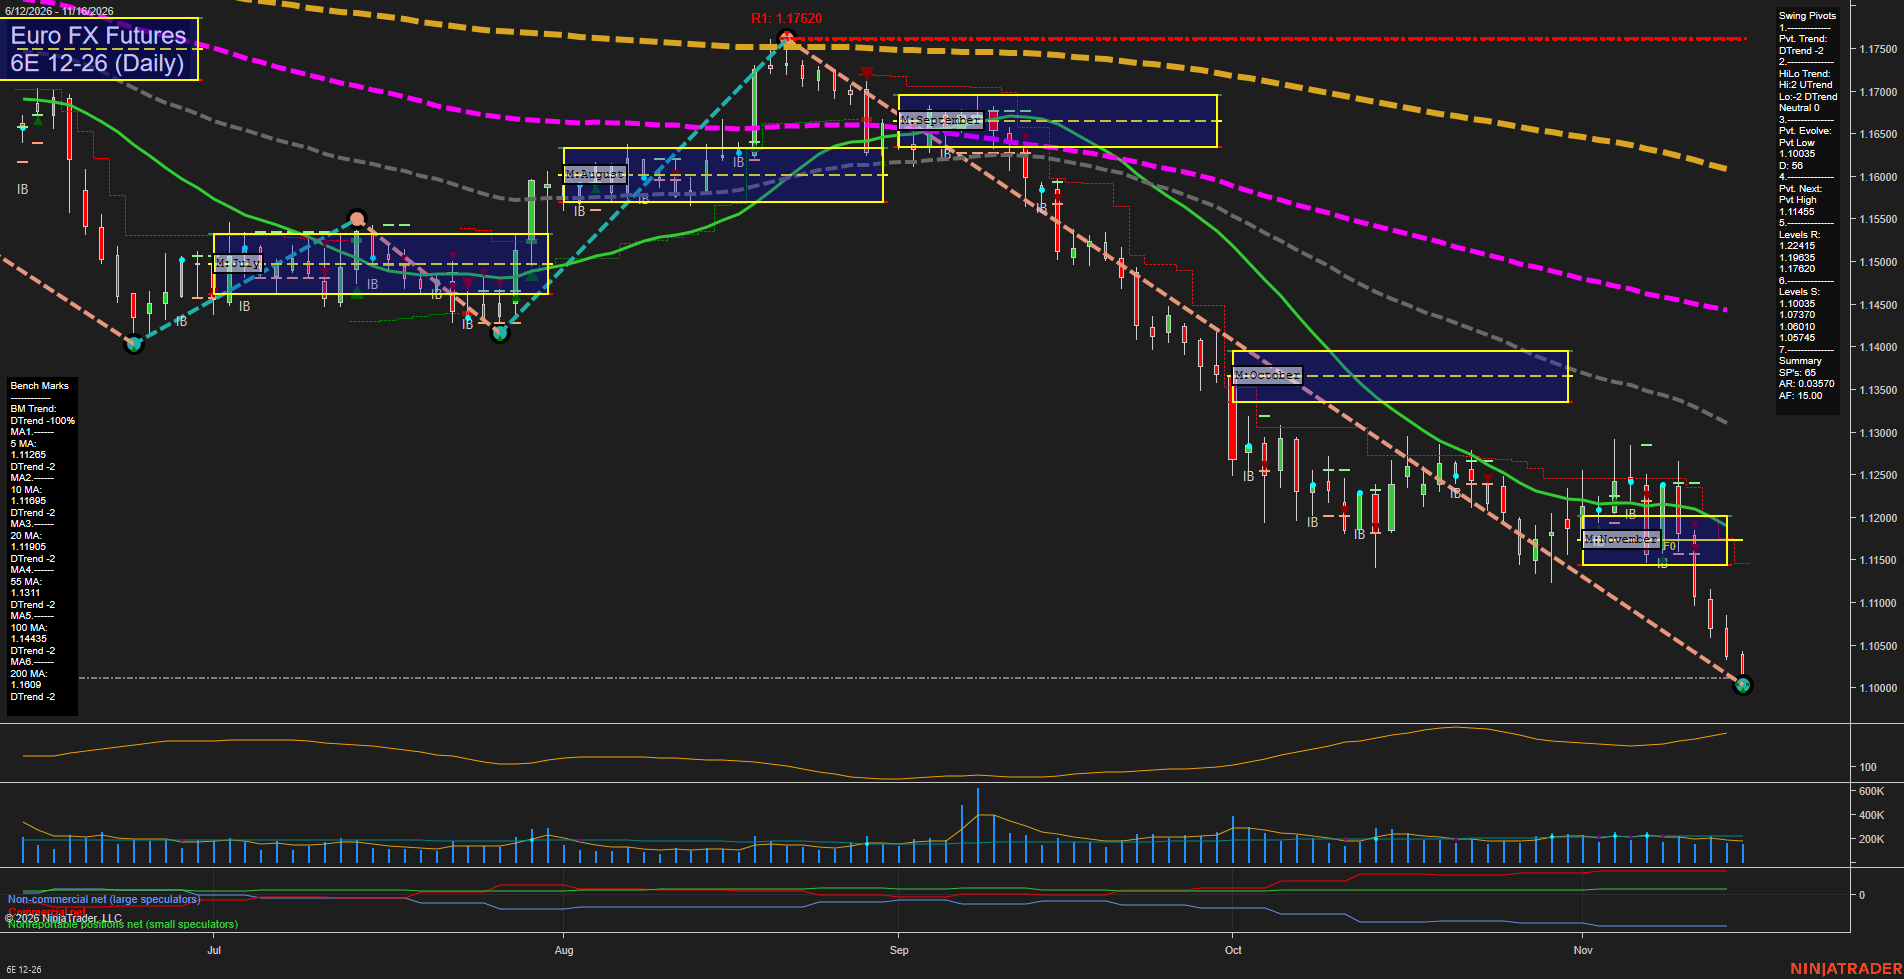
6E Euro FX Futures Daily Chart Analysis — After Market Close: 2026-Nov-16 15:01 CT
Price Action
- Last: approximately 1.10110,
- Bars: Medium,
- Mom: Momentum fast.
WSFG Weekly
- Near-Term
- WSFG Current: -21%
- F0%/NTZ' Bias: Price Below,
- WSFG Trend: Down.
MSFG Month Nov
- Medium-Term
- MSFG Current: -68%
- F0%/NTZ' Bias: Price Below,
- MSFG Trend: Down.
YSFG Year 2026
- Far-Term
- YSFG Current: -74%
- F0%/NTZ' Bias: Price Below,
- YSFG Trend: Down.
Swing Pivots
- (Near-Term) 1. Pvt. Trend: DTrend,
- (Medium-Term) 2. HiLo Trend: Neutral,
- 3. Pvt. Evolve: Pvt low 1.10035,
- 4. Pvt. Next: Pvt high 1.11455,
- 5. Levels R: 1.22415, 1.19635, 1.17620,
- 6. Levels S: 1.10035, 1.07370, 1.06010, 1.05745.
Daily Benchmarks
- (Near-Term) 5 Day: 1.11265 Down Trend,
- (Near-Term) 10 Day: 1.11695 Down Trend,
- (Medium-Term) 20 Day: 1.11905 Down Trend,
- (Medium-Term) 55 Day: 1.13110 Down Trend,
- (Far-Term) 100 Day: 1.14435 Down Trend,
- (Far-Term) 200 Day: 1.16090 Down Trend.
Additional Metrics
Recent Trade Signals
- 16 Nov 2026: Short 6E 12-26 @ 1.1011 Signals.USAR-WSFG
- 11 Nov 2026: Short 6E 12-26 @ 1.1147 Signals.USAR-MSFG
- 10 Nov 2026: Short 6E 12-26 @ 1.11675 Signals.USAR.TR120
Overall Rating
- Near-Term: Bearish,
- Medium-Term: Bearish,
- Far-Term: Bearish.
Key Insights Summary
From a futures swing-trading perspective, the dominant feature is renewed downside continuation after the early-November consolidation failed. Price has broken beneath the November NTZ and all six declining benchmarks, with successive bearish sessions extending the developing pivot low to 1.10035 near the psychological 1.10000 level. Weekly, monthly and yearly grid readings reinforce the bearish alignment, as do the three recent short signals. The HiLo summary remains neutral because its high-pivot and low-pivot trends diverge, but the medium-term weight of evidence is bearish. The 1.11455 opposite-pivot threshold and the 1.11265–1.11905 short-to-medium benchmark cluster sit well above current price, highlighting the depth of the latest downswing. ATR is turning higher, consistent with renewed volatility rather than a settled base. No confirmed reversal structure is evident; news and seasonal influences cannot be established from this chart alone.
Chart Analysis ATS AI Generated: 2026-11-16 15:01 for Informational use only, not trading advice. Terms and Risk Disclosure Copyright © 2026. Algo Trading Systems LLC.