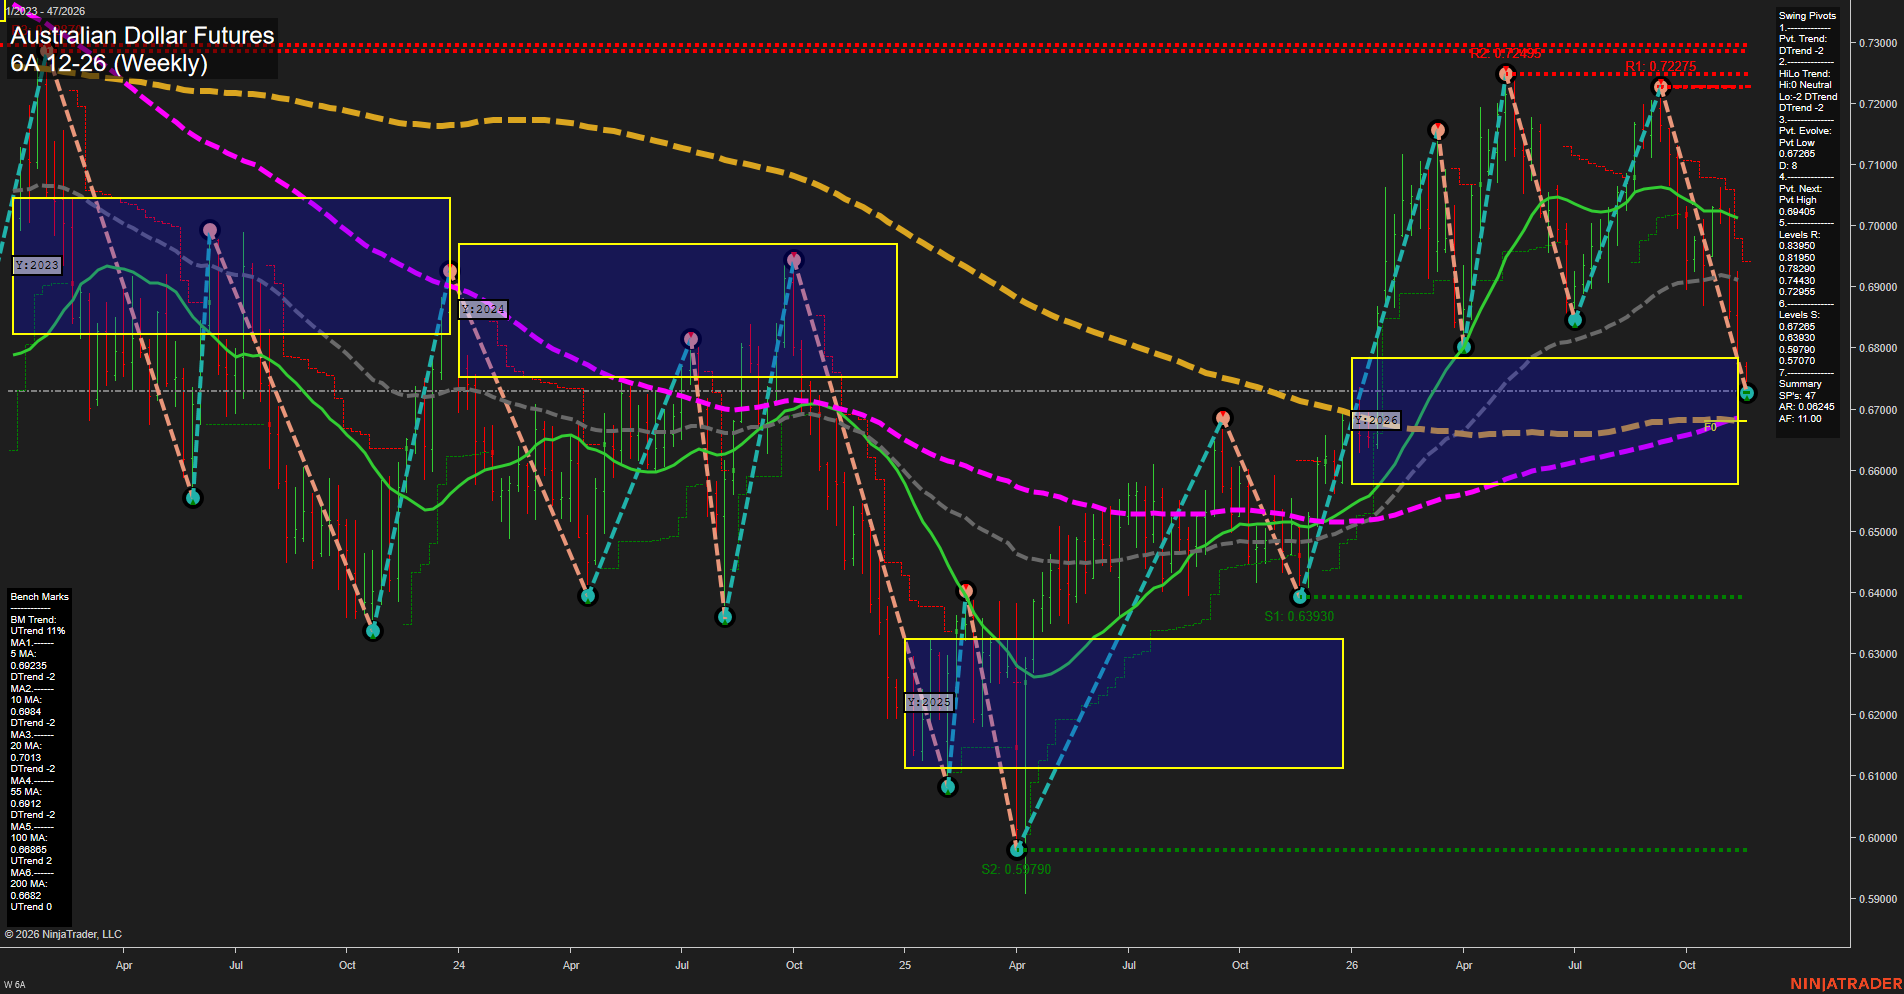
6A Australian Dollar Futures Weekly Chart Analysis — After Market Close: 2026-Nov-16 15:00 CT
Price Action
- Last: Approximately 0.6730,
- Bars: Large,
- Mom: Momentum fast.
WSFG Weekly
- Near-Term
- WSFG Current: -34%
- F0%/NTZ' Bias: Price Below,
- WSFG Trend: Down.
MSFG Month Nov
- Medium-Term
- MSFG Current: -136%
- F0%/NTZ' Bias: Price Below,
- MSFG Trend: Down.
YSFG Year 2026
- Far-Term
- YSFG Current: 5%
- F0%/NTZ' Bias: Price Above,
- YSFG Trend: Up.
Swing Pivots
- (Near-Term) 1. Pvt. Trend: DTrend,
- (Medium-Term) 2. HiLo Trend: DTrend,
- 3. Pvt. Evolve: Pvt low 0.67265,
- 4. Pvt. Next: Pvt high 0.69405,
- 5. Levels R: 0.83950, 0.81950, 0.78290, 0.74430, 0.72955,
- 6. Levels S: 0.67265, 0.63930, 0.59790, 0.57070.
Weekly Benchmarks
- (Near-Term) 5 Week: 0.69235 Down Trend,
- (Near-Term) 10 Week: 0.6984 Down Trend,
- (Medium-Term) 20 Week: 0.7013 Down Trend,
- (Medium-Term) 55 Week: 0.6912 Down Trend,
- (Far-Term) 100 Week: 0.66865 Up Trend,
- (Far-Term) 200 Week: 0.6682 Up Trend.
Recent Trade Signals
- 16 Nov 2026: Short 6A 12-26 @ 0.6752 Signals.USAR-WSFG
- 10 Nov 2026: Short 6A 12-26 @ 0.68435 Signals.USAR.TR120
Overall Rating
- Near-Term: Bearish,
- Medium-Term: Bearish,
- Far-Term: Bullish.
Key Insights Summary
The weekly swing structure shows a sharp selloff from the 0.72275 lower high, following the earlier 0.72495 peak. Price has broken below the intervening swing low near 0.684 and all four near- and medium-term benchmarks, confirming deterioration beyond a routine shallow pullback. Downward weekly and monthly grids and both recent short signals reinforce that bearish alignment. The evolving 0.67265 pivot low remains provisional, with the summary identifying 0.69405 as the opposite-pivot reversal threshold. Far-term conditions remain bullish but narrowly so: price is inside the yearly neutral zone, above its center line and the rising 100- and 200-week benchmarks clustered around 0.6682–0.66865. This creates a clear conflict between an active downswing and a still-positive longer-term recovery structure. No news or seasonal catalyst can be established from the chart alone.
Chart Analysis ATS AI Generated: 2026-11-16 15:00 for Informational use only, not trading advice. Terms and Risk Disclosure Copyright © 2026. Algo Trading Systems LLC.