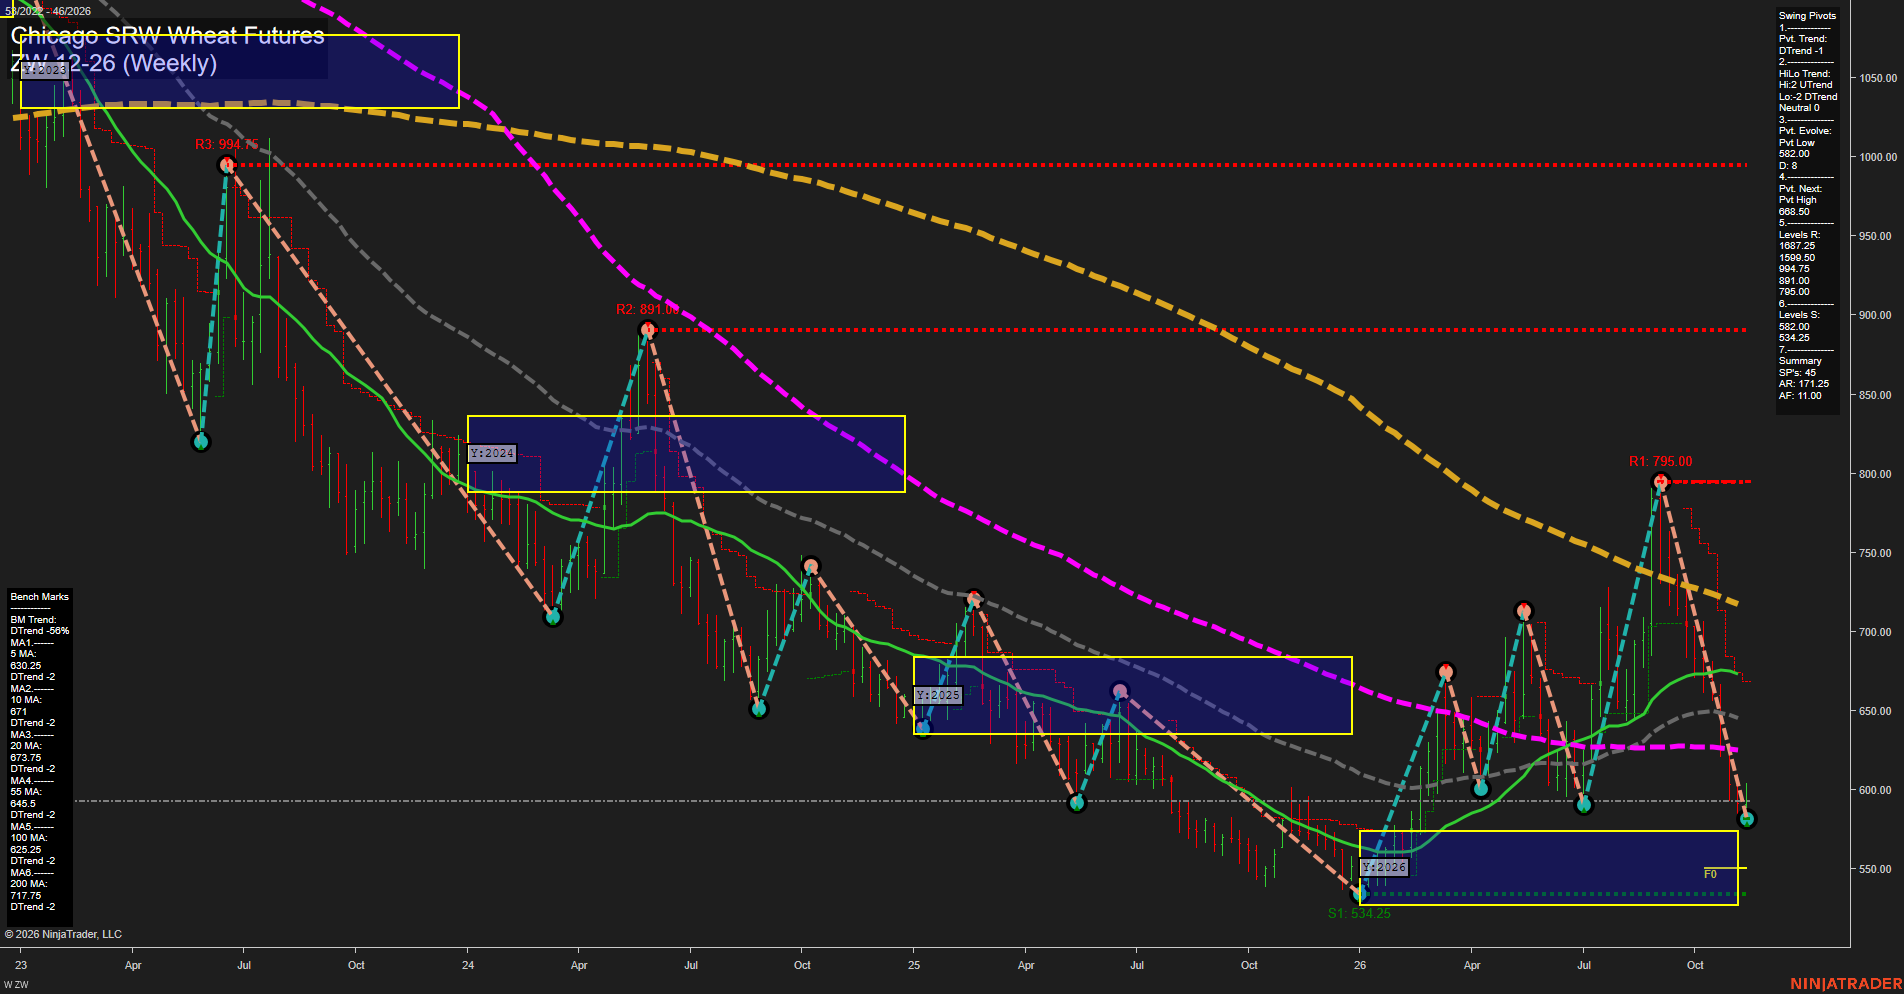
ZW Chicago SRW Wheat Futures Weekly Chart Analysis — Pre-Open: 2026-Nov-14 07:16 CT
Price Action
- Last: Approximately 593,
- Bars: Small,
- Mom: Momentum slow.
WSFG Weekly
- Near-Term
- WSFG Current: 8%
- F0%/NTZ' Bias: Price Above,
- WSFG Trend: Up.
MSFG Month Nov
- Medium-Term
- MSFG Current: -8%
- F0%/NTZ' Bias: Price Below,
- MSFG Trend: Down.
YSFG Year 2026
- Far-Term
- YSFG Current: 18%
- F0%/NTZ' Bias: Price Above,
- YSFG Trend: Up.
Swing Pivots
- (Near-Term) 1. Pvt. Trend: DTrend,
- (Medium-Term) 2. HiLo Trend: Neutral,
- 3. Pvt. Evolve: Pvt low 582.00,
- 4. Pvt. Next: Pvt high 668.50,
- 5. Levels R: 1687.25, 1599.50, 994.75, 891.00, 795.00,
- 6. Levels S: 582.00, 534.25.
Weekly Benchmarks
- (Near-Term) 5 Week: 630.25 Down Trend,
- (Near-Term) 10 Week: 671.00 Down Trend,
- (Medium-Term) 20 Week: 673.75 Down Trend,
- (Medium-Term) 55 Week: 645.50 Down Trend,
- (Far-Term) 100 Week: 625.25 Down Trend,
- (Far-Term) 200 Week: 717.75 Down Trend.
Recent Trade Signals
- 13 Nov 2026: Long ZW 12-26 @ 597 Signals.USAR-WSFG
- 12 Nov 2026: Short ZW 12-26 @ 588.25 Signals.USAR-MSFG
- 11 Nov 2026: Long ZW 12-26 @ 602.25 Signals.USAR.TR120
Overall Rating
- Near-Term: Bullish,
- Medium-Term: Bearish,
- Far-Term: Bearish.
Key Insights Summary
The near-term bullish rating reflects the rising weekly grid and two recent long signals, but describes a countertrend recovery rather than an established weekly reversal. Price is stabilizing just above the evolving 582.00 pivot low after a sharp retreat from 795.00; the small latest bar indicates slowing immediate momentum following that selloff. All six benchmarks slope downward and remain above price, maintaining a bearish broader backdrop. The HiLo summary is neutral, reflecting mixed higher-high and lower-low structure rather than a clean medium-term trend. Support is concentrated at 582.00 and 534.25, while the 625.25–630.25 benchmark area forms the nearest overhead technical barrier. The next opposite pivot threshold is 668.50. The positive yearly grid contrasts with declining long-term averages, distinguishing recovery within the annual range from a durable major-trend reversal. Alternating recent long and short signals highlight choppy, timeframe-dependent conditions; no news or seasonal catalyst is established by the chart alone.
Chart Analysis ATS AI Generated: 2026-11-14 07:16 for Informational use only, not trading advice. Terms and Risk Disclosure Copyright © 2026. Algo Trading Systems LLC.