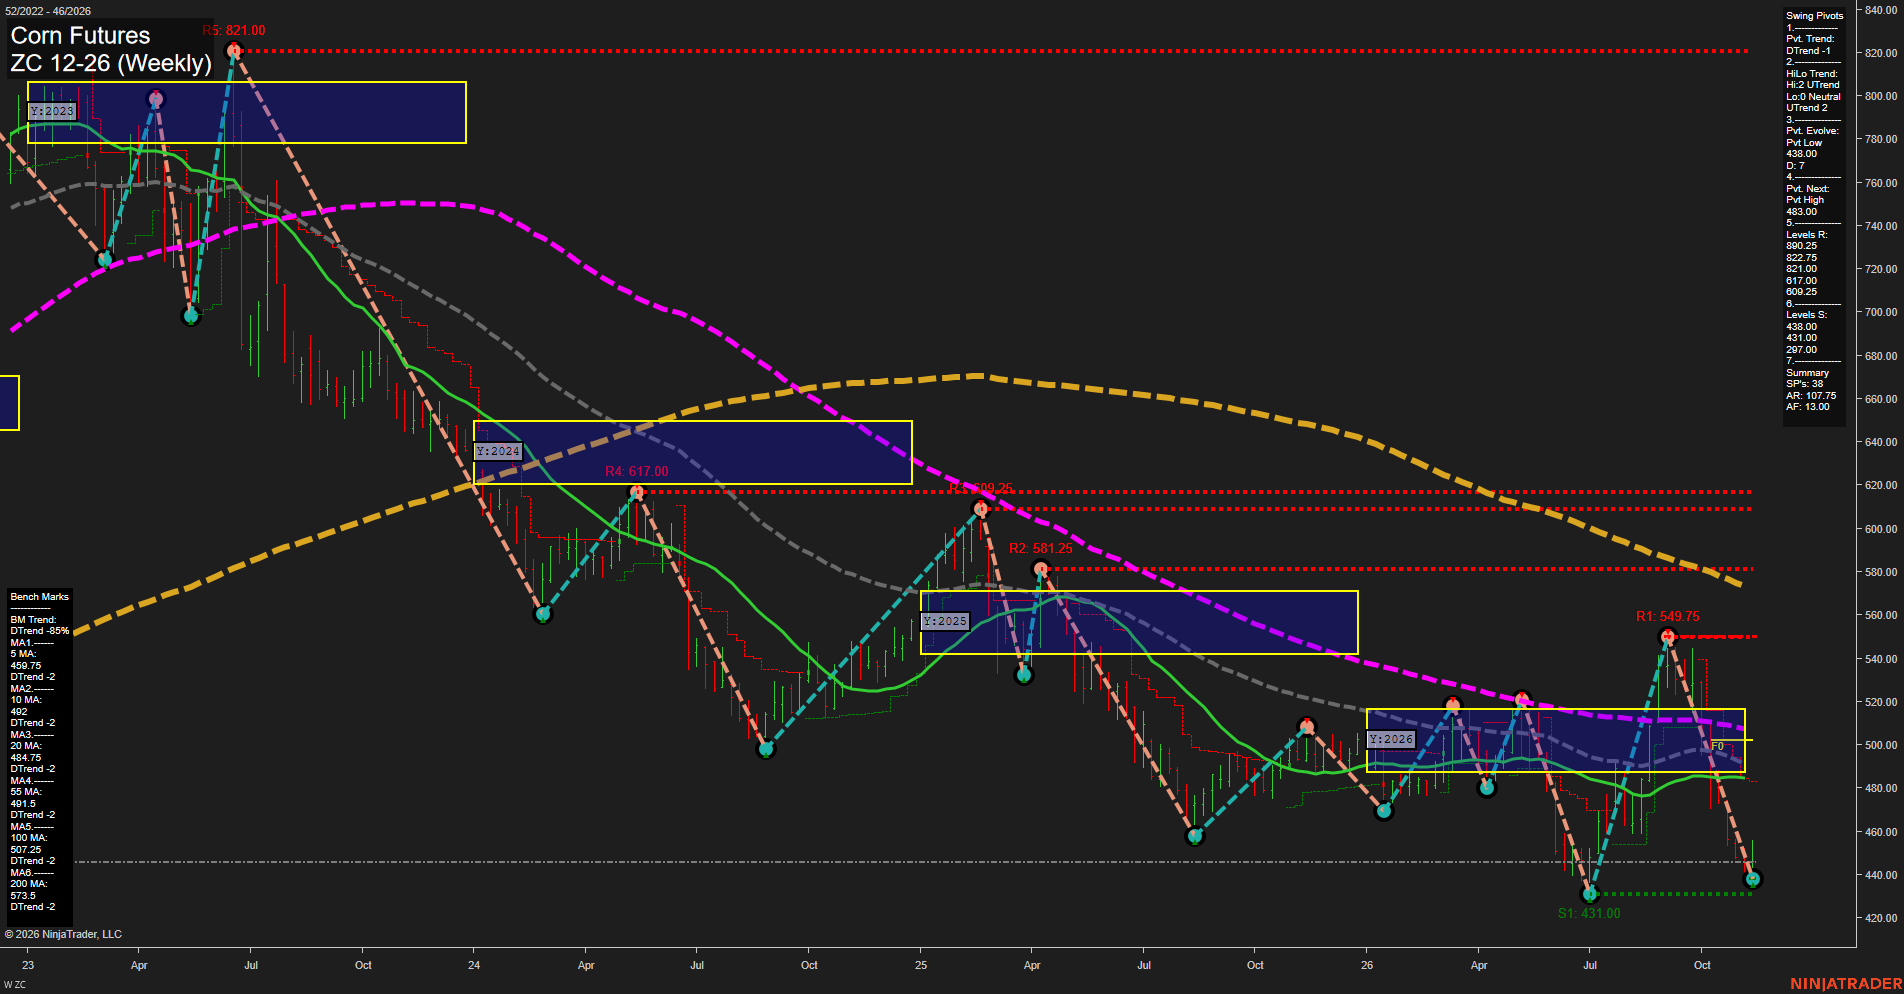
ZC Corn Futures Weekly Chart Analysis — Pre-Open: 2026-Nov-14 07:15 CT
Price Action
- Last: Approximately 446.00,
- Bars: Large,
- Mom: Momentum fast.
WSFG Weekly
- Near-Term
- WSFG Current: 31%
- F0%/NTZ' Bias: Price Above,
- WSFG Trend: Up.
MSFG Month Nov
- Medium-Term
- MSFG Current: -3%
- F0%/NTZ' Bias: Price Below,
- MSFG Trend: Down.
YSFG Year 2026
- Far-Term
- YSFG Current: -38%
- F0%/NTZ' Bias: Price Below,
- YSFG Trend: Down.
Swing Pivots
- (Near-Term) 1. Pvt. Trend: DTrend,
- (Medium-Term) 2. HiLo Trend: UTrend,
- 3. Pvt. Evolve: Pvt low 438.00,
- 4. Pvt. Next: Pvt high 483.00,
- 5. Levels R: 890.25, 822.75, 821.00, 617.00, 609.25,
- 6. Levels S: 438.00, 431.00, 297.00.
Weekly Benchmarks
- (Near-Term) 5 Week: 459.75 Down Trend,
- (Near-Term) 10 Week: 492.00 Down Trend,
- (Medium-Term) 20 Week: 484.75 Down Trend,
- (Medium-Term) 55 Week: 491.50 Down Trend,
- (Far-Term) 100 Week: 507.25 Down Trend,
- (Far-Term) 200 Week: 573.50 Down Trend.
Recent Trade Signals
- 10 Nov 2026: Short ZC 12-26 @ 440.75 Signals.USAR-MSFG
- 09 Nov 2026: Short ZC 12-26 @ 439.25 Signals.USAR-WSFG
Overall Rating
- Near-Term: Bearish,
- Medium-Term: Bearish,
- Far-Term: Bearish.
Key Insights Summary
Corn remains in a broad bearish weekly structure, with the sharp reversal from 549.75 carrying price below all six declining benchmarks. The evolving 438.00 pivot low sits just above 431.00 support, leaving the recent rebound within a larger downswing. Near-term conditions are mixed: the weekly grid points up, but the pivot trend, short-term benchmarks and recent short signals remain bearish. The medium-term HiLo UTrend reflects residual higher-pivot structure rather than broad trend confirmation; the declining monthly grid and 20- and 55-week benchmarks outweigh it. Price below the yearly neutral zone and falling long-term averages reinforces the bearish far-term assessment. The 483.00 next-pivot threshold and 484.75–492.00 benchmark cluster define overhead structural resistance. The chart alone does not establish a news catalyst or confirm a seasonal turning point.
Chart Analysis ATS AI Generated: 2026-11-14 07:16 for Informational use only, not trading advice. Terms and Risk Disclosure Copyright © 2026. Algo Trading Systems LLC.