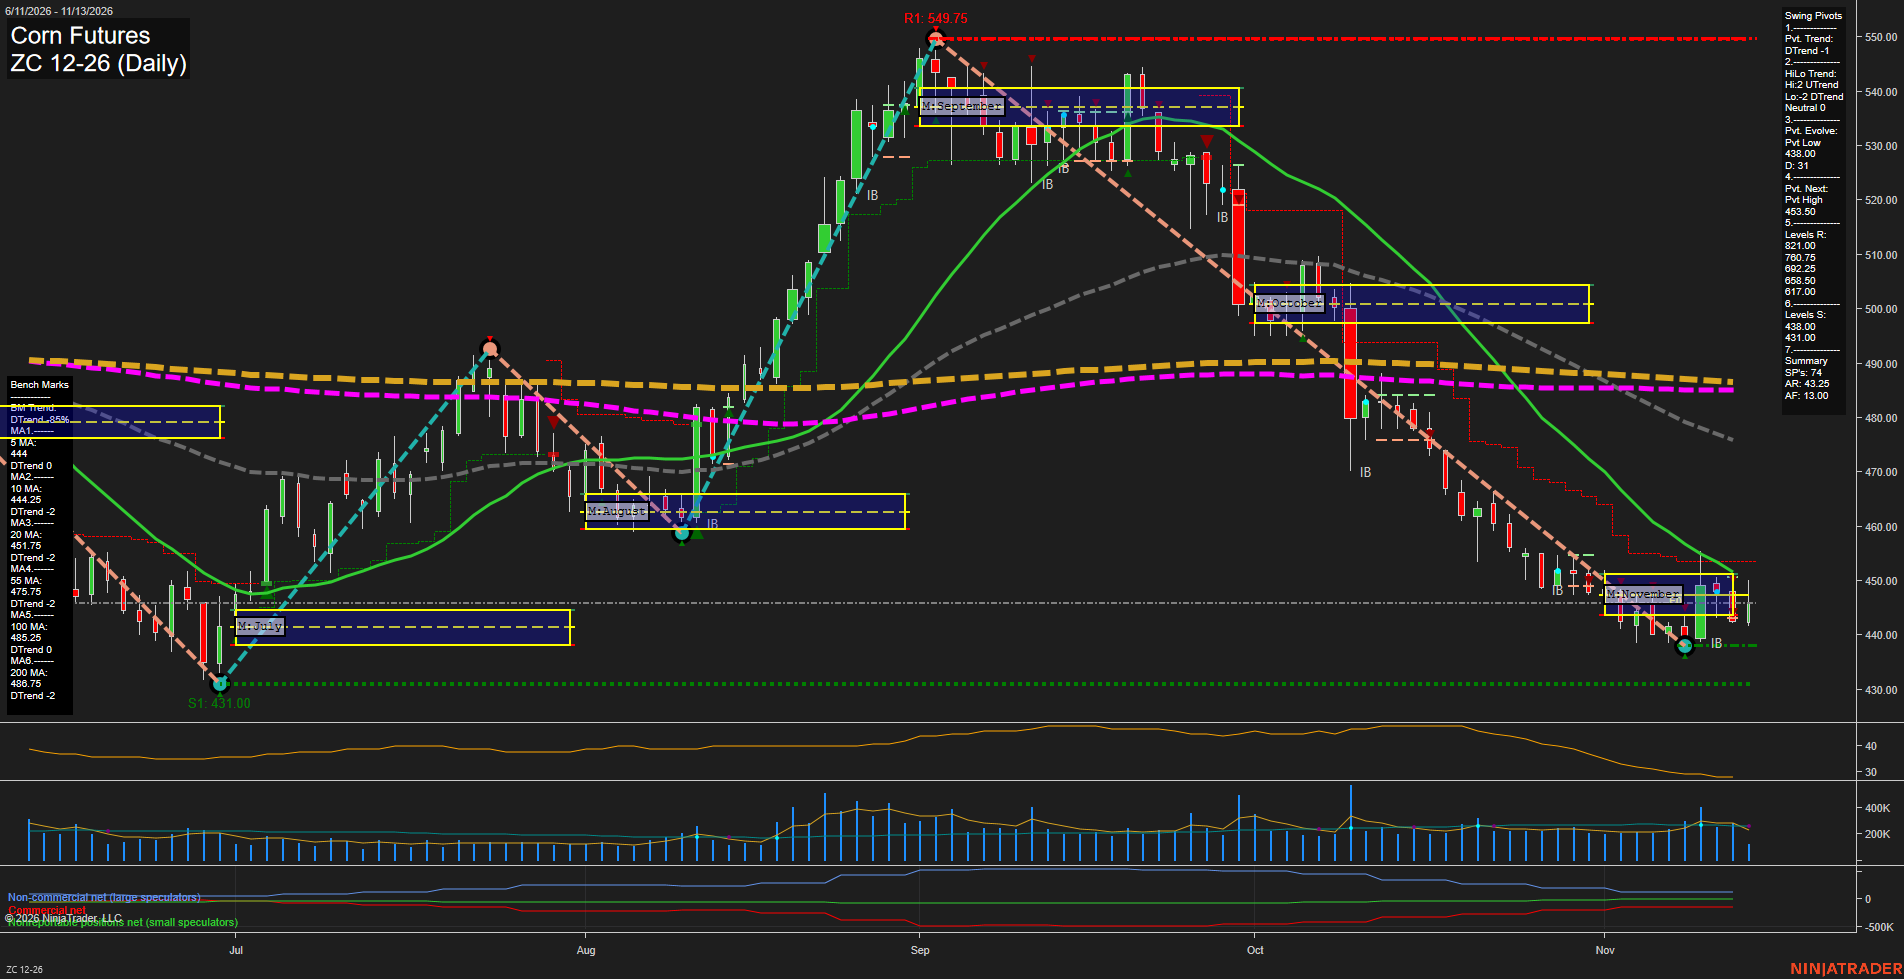
ZC Corn Futures Daily Chart Analysis — Pre-Open: 2026-Nov-14 07:15 CT
Price Action
- Last: approximately 446.00,
- Bars: Small,
- Mom: Momentum slow.
WSFG Weekly
- Near-Term
- WSFG Current: 31%
- F0%/NTZ' Bias: Price Above,
- WSFG Trend: Up.
MSFG Month Nov
- Medium-Term
- MSFG Current: -3%
- F0%/NTZ' Bias: Price Below,
- MSFG Trend: Down.
YSFG Year 2026
- Far-Term
- YSFG Current: -38%
- F0%/NTZ' Bias: Price Below,
- YSFG Trend: Down.
Swing Pivots
- (Near-Term) 1. Pvt. Trend: DTrend,
- (Medium-Term) 2. HiLo Trend: Neutral (highs UTrend; lows DTrend),
- 3. Pvt. Evolve: Pvt low 438.00,
- 4. Pvt. Next: Pvt high 453.50,
- 5. Levels R: 821.00, 760.75, 692.25, 658.50, 617.00,
- 6. Levels S: 438.00, 431.00.
Daily Benchmarks
- (Near-Term) 5 Day: 444.00 Down Trend,
- (Near-Term) 10 Day: 444.25 Down Trend,
- (Medium-Term) 20 Day: 451.75 Down Trend,
- (Medium-Term) 55 Day: 475.75 Down Trend,
- (Far-Term) 100 Day: 485.25 Down Trend,
- (Far-Term) 200 Day: 486.75 Down Trend.
Additional Metrics
Recent Trade Signals
- 10 Nov 2026: Short ZC 12-26 @ 440.75 Signals.USAR-MSFG
- 09 Nov 2026: Short ZC 12-26 @ 439.25 Signals.USAR-WSFG
Overall Rating
- Near-Term: Bearish,
- Medium-Term: Bearish,
- Far-Term: Bearish.
Key Insights Summary
From a futures swing-trader perspective, the rebound from 438.00 remains a countertrend bounce within the decline from September’s 549.75 high. Weekly strength and price above the 5- and 10-day averages show improving immediate positioning, but both averages still trend down and the pivot trend remains bearish. Small recent bars and declining ATR indicate consolidation and slower momentum rather than an established reversal. The 451.75 moving average and 453.50 next-pivot threshold frame nearby overhead resistance; 438.00 and 431.00 remain the listed supports. The pivot summary’s resistance list contains distant historical levels rather than nearby barriers. Monthly and yearly grid weakness, declining longer-term averages, and the supplied short signals maintain the broader bearish alignment. No news catalyst or seasonal conclusion can be verified from this chart alone.
Chart Analysis ATS AI Generated: 2026-11-14 07:15 for Informational use only, not trading advice. Terms and Risk Disclosure Copyright © 2026. Algo Trading Systems LLC.