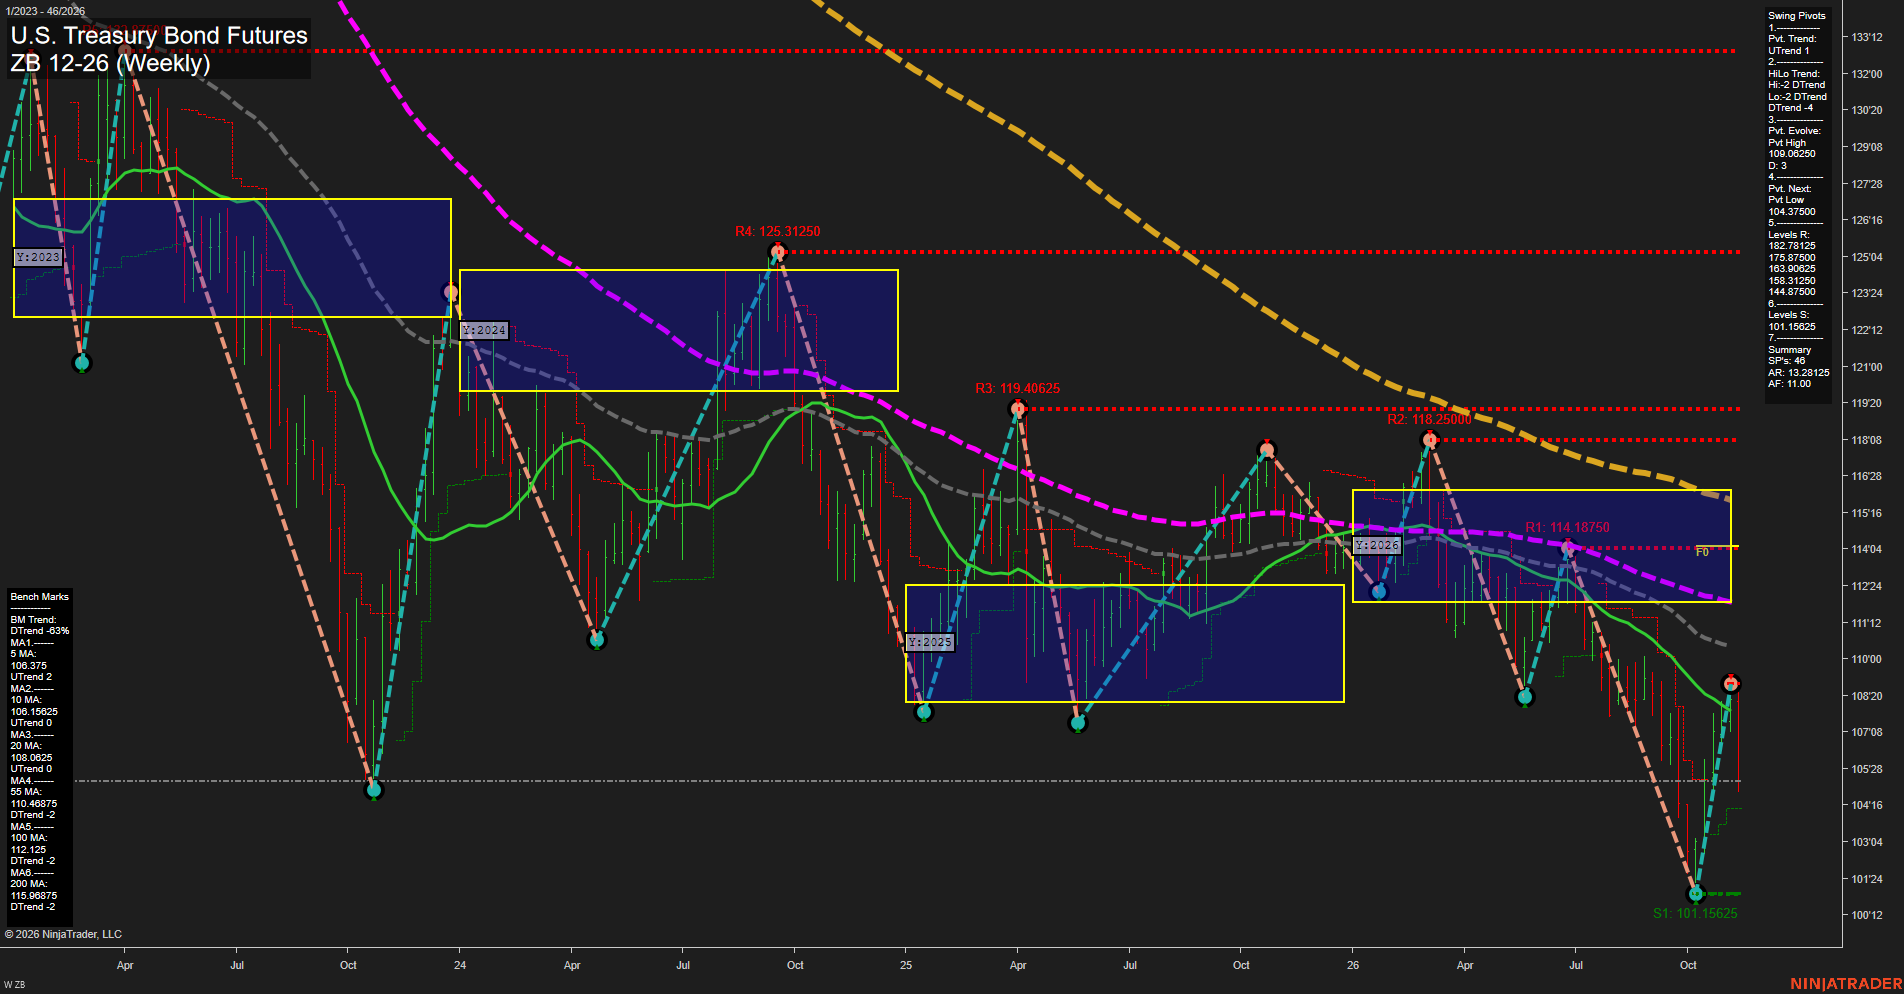
ZB U.S. Treasury Bond Futures Weekly Chart Analysis — Pre-Open: 2026-Nov-14 07:15 CT
Price Action
- Last: Approximately 105.44,
- Bars: Large,
- Mom: Momentum fast.
WSFG Weekly
- Near-Term
- WSFG Current: -115%
- F0%/NTZ' Bias: Price Below,
- WSFG Trend: Down.
MSFG Month Nov
- Medium-Term
- MSFG Current: -44%
- F0%/NTZ' Bias: Price Below,
- MSFG Trend: Down.
YSFG Year 2026
- Far-Term
- YSFG Current: -42%
- F0%/NTZ' Bias: Price Below,
- YSFG Trend: Down.
Swing Pivots
- (Near-Term) 1. Pvt. Trend: UTrend,
- (Medium-Term) 2. HiLo Trend: DTrend,
- 3. Pvt. Evolve: Pvt high 109.06250,
- 4. Pvt. Next: Pvt low 104.37500,
- 5. Levels R: 182.78125, 175.87500, 163.90625, 158.31250, 144.87500,
- 6. Levels S: 101.15625.
Weekly Benchmarks
- (Near-Term) 5 Week: 106.375 Up Trend,
- (Near-Term) 10 Week: 106.15625 Up Trend,
- (Medium-Term) 20 Week: 108.0625 Up Trend,
- (Medium-Term) 55 Week: 110.46875 Down Trend,
- (Far-Term) 100 Week: 112.125 Down Trend,
- (Far-Term) 200 Week: 115.96875 Down Trend.
Overall Rating
- Near-Term: Neutral,
- Medium-Term: Bearish,
- Far-Term: Bearish.
Key Insights Summary
The rebound from 101.15625 to the evolving 109.06250 pivot high represents a sharp countertrend rally within a broader lower-high, lower-low structure. The latest large downside bar has erased much of that rebound and returned price below all six weekly benchmarks. Near-term conditions remain mixed because the pivot trend and short moving-average slopes are still positive, while the weekly grid and latest price action are bearish. The 104.37500 next-pivot threshold separates the existing upward pivot leg from a new downward pivot phase. Beyond the evolving high, visible chart resistance stands at 114.18750, 118.25000 and 119.40625; the resistance values reported in the summary are much more distant historical levels. Falling longer-term benchmarks and price below the yearly neutral zone reinforce the broader bearish regime. Recent signal labels, news catalysts and seasonal evidence are not identifiable in this image and are not incorporated into the ratings.
Chart Analysis ATS AI Generated: 2026-11-14 07:15 for Informational use only, not trading advice. Terms and Risk Disclosure Copyright © 2026. Algo Trading Systems LLC.