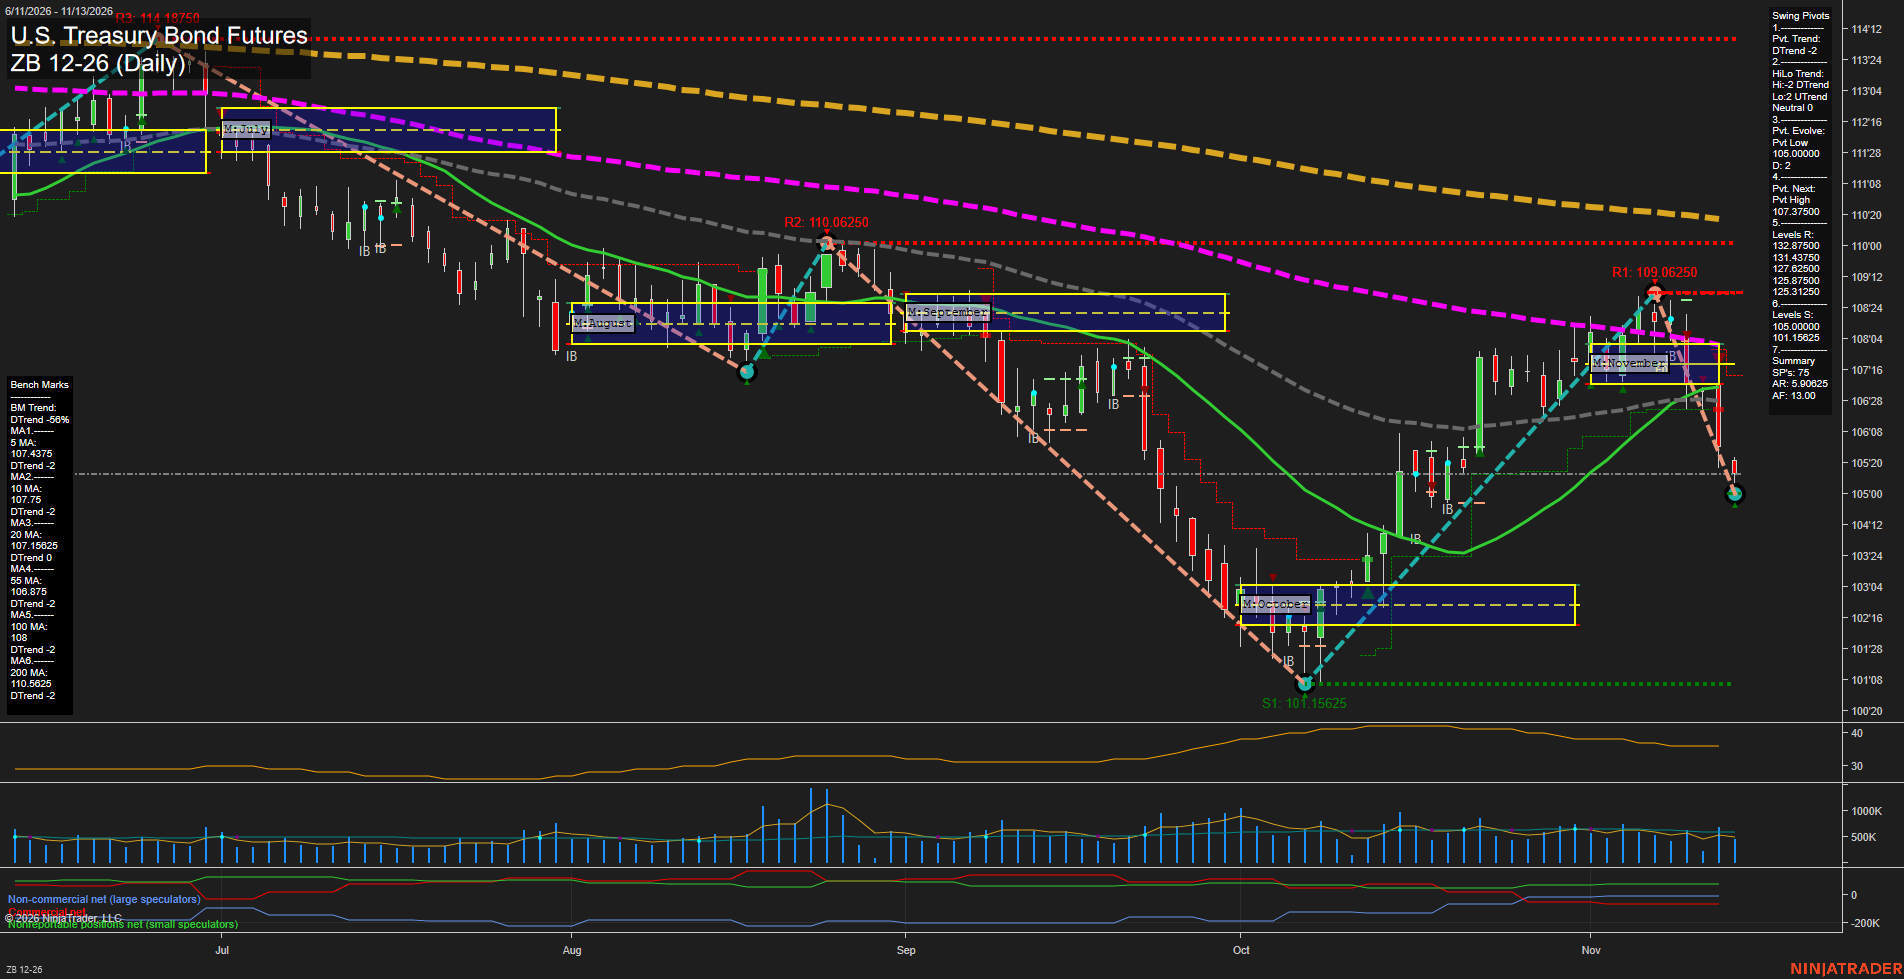
ZB U.S. Treasury Bond Futures Daily Chart Analysis — Pre-Open: 2026-Nov-14 07:15 CT
Price Action
- Last: Approximately 105.3125,
- Bars: Small latest bar following large bearish bars,
- Mom: Fast downside momentum.
WSFG Weekly
- Near-Term
- WSFG Current: -115%
- F0%/NTZ' Bias: Price Below,
- WSFG Trend: Down.
MSFG Month Nov
- Medium-Term
- MSFG Current: -44%
- F0%/NTZ' Bias: Price Below,
- MSFG Trend: Down.
YSFG Year 2026
- Far-Term
- YSFG Current: -42%
- F0%/NTZ' Bias: Price Below,
- YSFG Trend: Down.
Swing Pivots
- (Near-Term) 1. Pvt. Trend: DTrend,
- (Medium-Term) 2. HiLo Trend: DTrend,
- 3. Pvt. Evolve: Pvt low 105.00000,
- 4. Pvt. Next: Pvt high 107.37500,
- 5. Levels R: 132.87500, 131.43750, 127.62500, 125.87500, 125.31250,
- 6. Levels S: 105.00000, 101.15625.
Daily Benchmarks
- (Near-Term) 5 Day: 107.4375 Down Trend,
- (Near-Term) 10 Day: 107.75 Down Trend,
- (Medium-Term) 20 Day: 107.15625 Down Trend,
- (Medium-Term) 55 Day: 106.875 Down Trend,
- (Far-Term) 100 Day: 108 Down Trend,
- (Far-Term) 200 Day: 110.5625 Down Trend.
Additional Metrics
Overall Rating
- Near-Term: Bearish,
- Medium-Term: Bearish,
- Far-Term: Bearish.
Key Insights Summary
The October recovery has reversed sharply after rejection at the visible 109.06250 swing high, leaving a lower high beneath August's 110.06250 peak. Price has broken below the November NTZ and all six benchmarks, aligning the latest selloff with bearish weekly, monthly and yearly grid readings. The evolving 105.00000 low remains above October's 101.15625 low, so the larger structure combines lower highs with a still-higher low rather than a confirmed fresh major-low breakdown. The latest small candle indicates a pause after forceful selling, not a confirmed reversal; the pivot summary places the opposite-pivot threshold at 107.37500. The summary's listed resistance levels are well above the displayed market; visible chart resistance is nearer at 109.06250, 110.06250 and 114.18750. Technical evidence supports bearish readings across all horizons, while specific news catalysts, seasonal effects and named signal-system readings cannot be verified from this image.
Chart Analysis ATS AI Generated: 2026-11-14 07:15 for Informational use only, not trading advice. Terms and Risk Disclosure Copyright © 2026. Algo Trading Systems LLC.