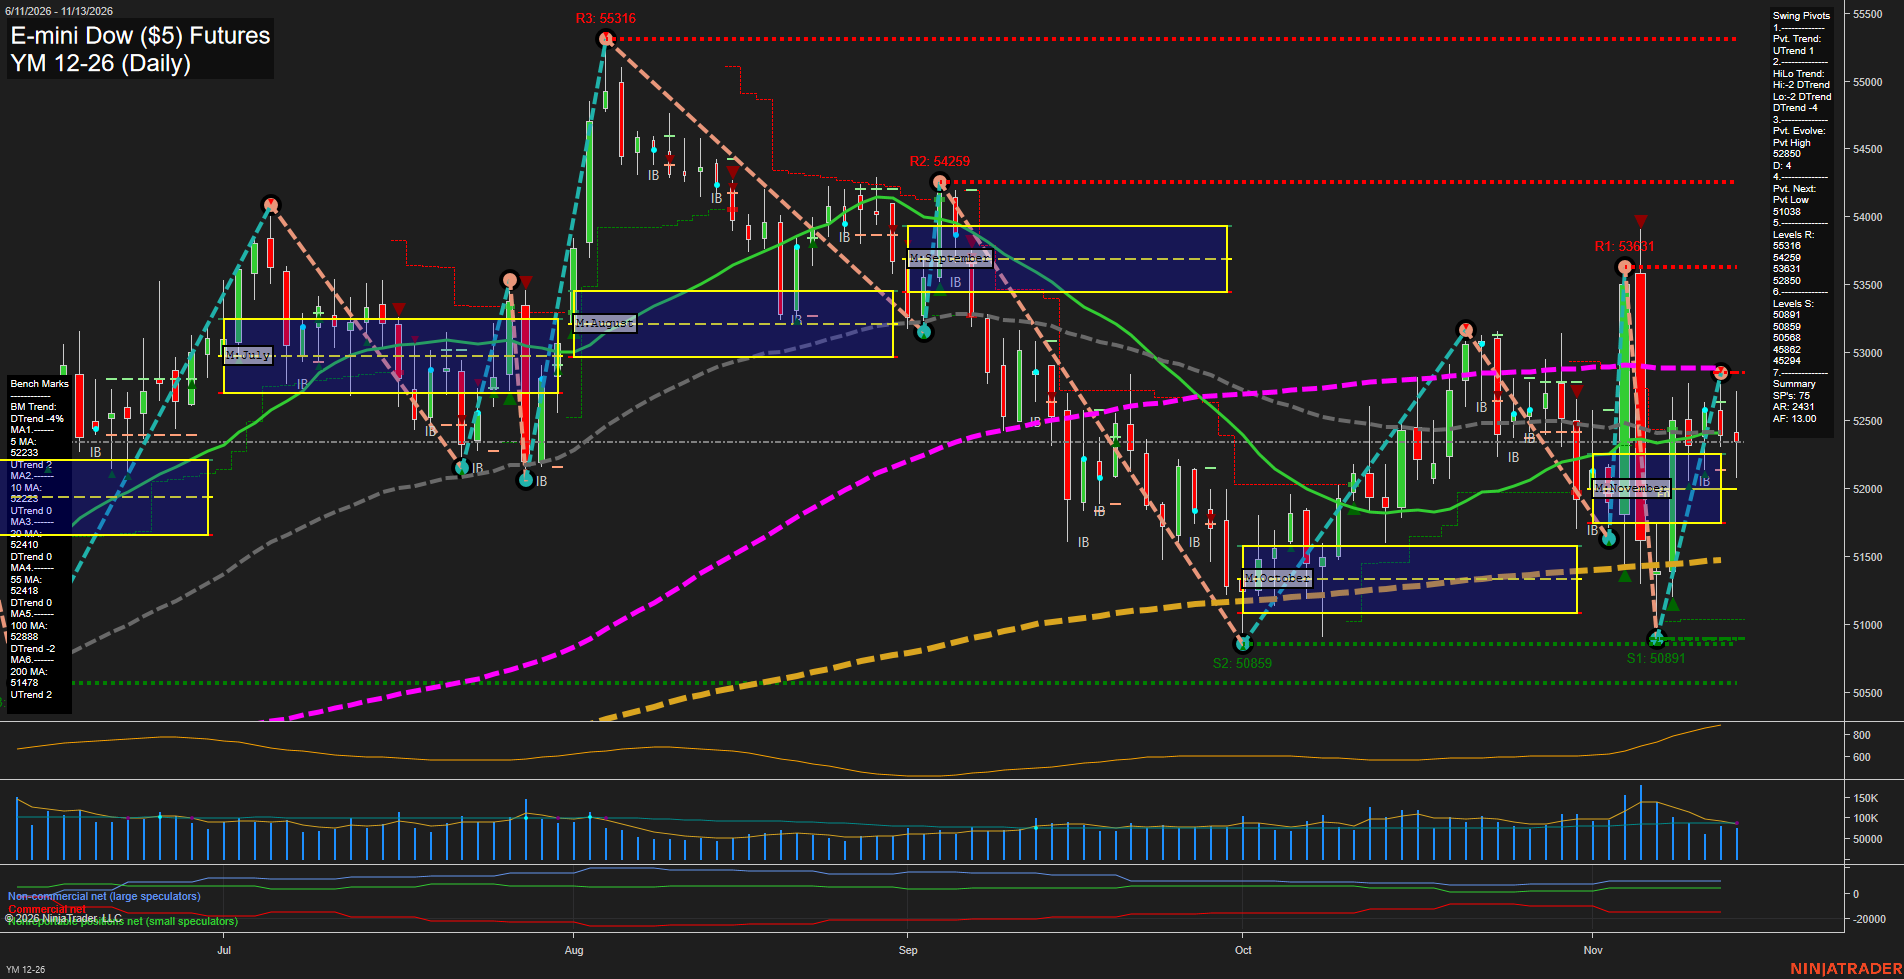
YM E-mini Dow ($5) Futures Daily Chart Analysis — Pre-Open: 2026-Nov-14 07:14 CT
Price Action
- Last: Approximately 52350,
- Bars: Medium,
- Mom: Momentum average.
WSFG Weekly
- Near-Term
- WSFG Current: 56%
- F0%/NTZ' Bias: Price Above,
- WSFG Trend: Up.
MSFG Month Nov
- Medium-Term
- MSFG Current: 15%
- F0%/NTZ' Bias: Price Above,
- MSFG Trend: Up.
YSFG Year 2026
- Far-Term
- YSFG Current: 32%
- F0%/NTZ' Bias: Price Above,
- YSFG Trend: Up.
Swing Pivots
- (Near-Term) 1. Pvt. Trend: UTrend,
- (Medium-Term) 2. HiLo Trend: DTrend,
- 3. Pvt. Evolve: Pvt high 52850,
- 4. Pvt. Next: Pvt low 51038,
- 5. Levels R: 55316, 54259, 53631, 52850,
- 6. Levels S: 50891, 50859, 50568, 45862, 45294.
Daily Benchmarks
- (Near-Term) 5 Day: 52233 Up Trend,
- (Near-Term) 10 Day: 52223 Up Trend,
- (Medium-Term) 20 Day: 52410 Down Trend,
- (Medium-Term) 55 Day: 52418 Down Trend,
- (Far-Term) 100 Day: 52888 Down Trend,
- (Far-Term) 200 Day: 51478 Up Trend.
Additional Metrics
Recent Trade Signals
- 09 Nov 2026: Long YM 12-26 @ 52363 Signals.USAR-MSFG
- 09 Nov 2026: Long YM 12-26 @ 51732 Signals.USAR-WSFG
Overall Rating
- Near-Term: Bullish,
- Medium-Term: Bearish,
- Far-Term: Bullish.
Key Insights Summary
The near-term upswing represents a rebound within a still-declining medium-term pivot structure. Price is above the rising 5- and 10-day benchmarks and November NTZ, supporting the bullish weekly and monthly grid readings. However, the latest pullback leaves price just below the declining 20- and 55-day benchmarks at 52410–52418. Resistance clusters around the evolving pivot high at 52850 and 100-day benchmark at 52888, followed by 53631. The closely spaced October and November lows at 50859–50891 form a potential double-bottom base, but lower medium-term highs leave that recovery unconfirmed. The rising 200-day benchmark supports the broader bullish backdrop. Recent wide swings and subsequent smaller candles describe a volatile rebound losing immediate momentum rather than a clean trend continuation. The supplied long signals align with the recovery; no TR120 or TR720 signals or news catalysts are shown.
Chart Analysis ATS AI Generated: 2026-11-14 07:14 for Informational use only, not trading advice. Terms and Risk Disclosure Copyright © 2026. Algo Trading Systems LLC.