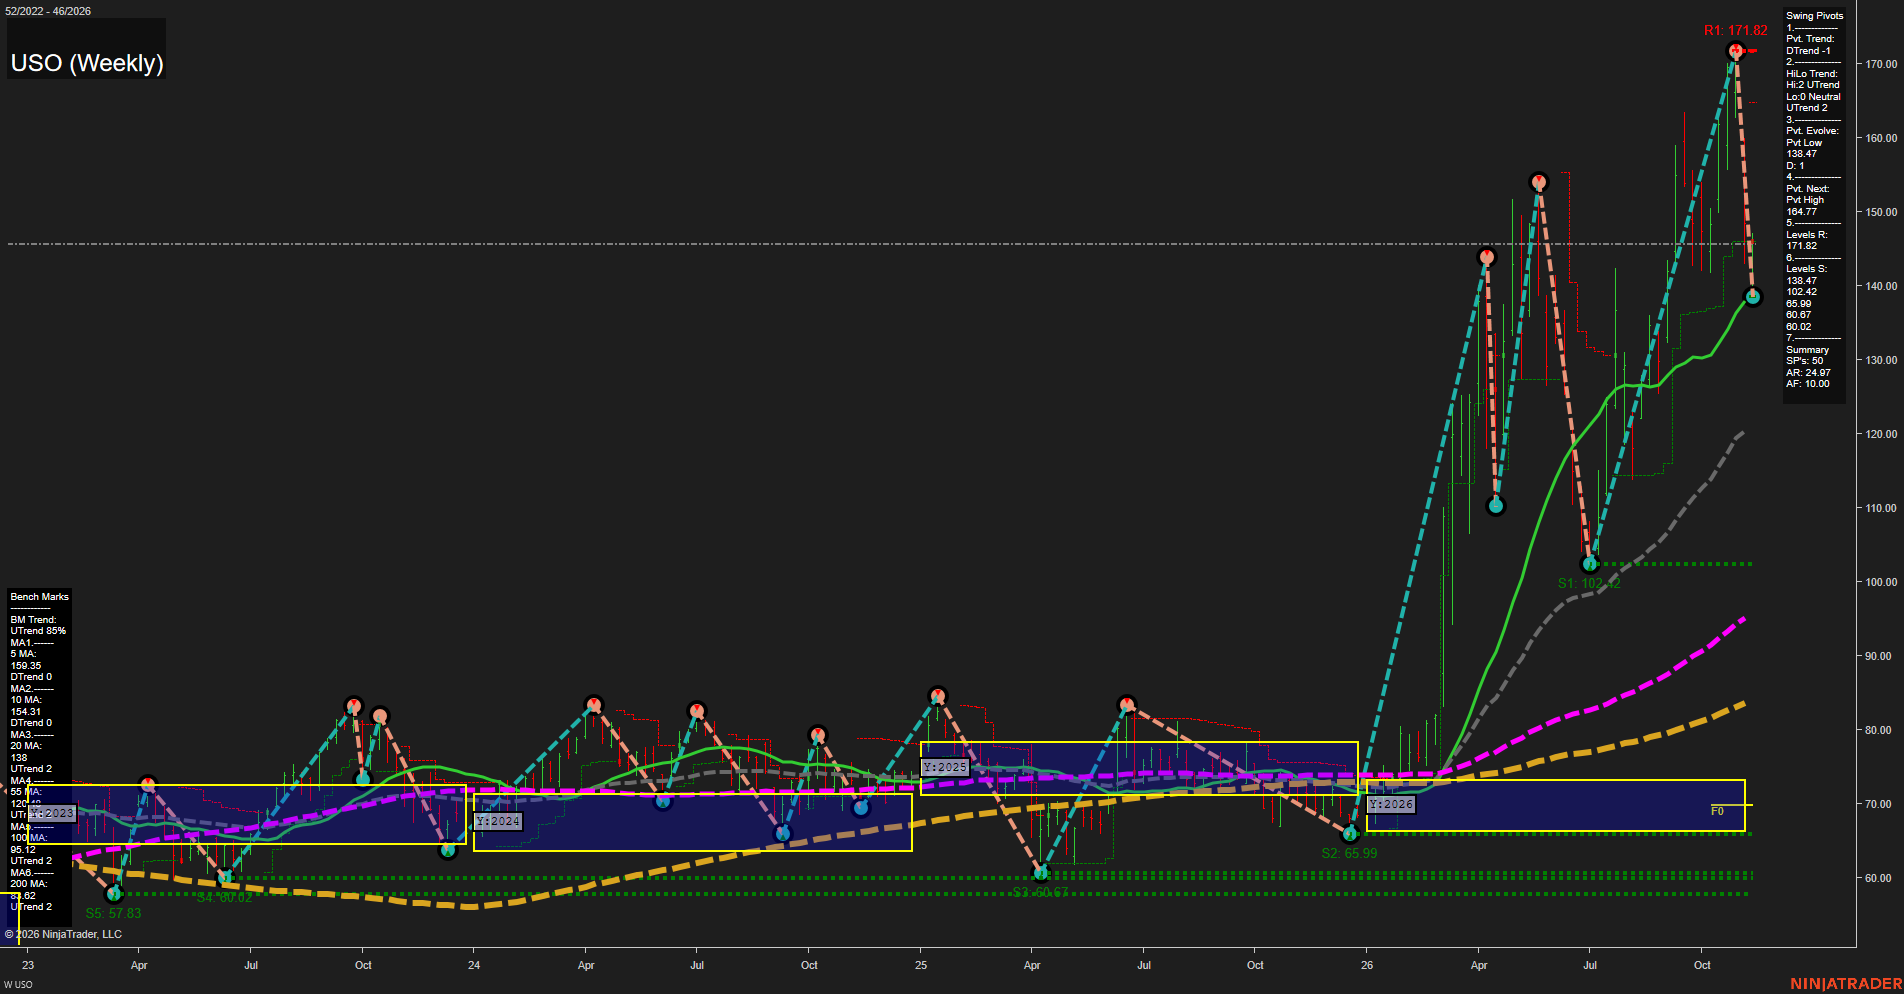
USO United States Oil Fund LP Weekly Chart Analysis — Pre-Open: 2026-Nov-14 07:14 CT
Price Action
- Last: Approximately 146.00,
- Bars: Large,
- Mom: Fast downside momentum within a broader advance.
WSFG Weekly
- Near-Term
- WSFG Current: NA%
- F0%/NTZ' Bias: Price Neutral,
- WSFG Trend: Neutral.
MSFG Month Nov
- Medium-Term
- MSFG Current: NA%
- F0%/NTZ' Bias: Price Neutral,
- MSFG Trend: Neutral.
YSFG Year 2026
- Far-Term
- YSFG Current: NA%
- F0%/NTZ' Bias: Price Neutral,
- YSFG Trend: Neutral.
Swing Pivots
- (Near-Term) 1. Pvt. Trend: DTrend,
- (Medium-Term) 2. HiLo Trend: UTrend,
- 3. Pvt. Evolve: Pvt low 138.47,
- 4. Pvt. Next: Pvt high 164.77,
- 5. Levels R: 171.82,
- 6. Levels S: 138.47, 102.42, 65.99, 60.67, 60.02.
Weekly Benchmarks
- (Near-Term) 5 Week: 159.35 Down Trend,
- (Near-Term) 10 Week: 154.31 Down Trend,
- (Medium-Term) 20 Week: 138.00 Up Trend,
- (Medium-Term) 55 Week: Approximately 120.50 Up Trend,
- (Far-Term) 100 Week: 95.12 Up Trend,
- (Far-Term) 200 Week: 83.62 Up Trend.
Overall Rating
- Near-Term: Bearish,
- Medium-Term: Bullish,
- Far-Term: Bullish.
Key Insights Summary
From a futures swing-trader perspective, this is a sharp countertrend correction within a larger bullish price structure. The decline from 171.82 to the evolving 138.47 low is approximately 19%, illustrating substantial weekly volatility. Price is below the falling 5- and 10-week benchmarks but remains above the rising 20-week benchmark, where the latest decline has tested the 138.00–138.47 support area. The medium-term pivot summary remains bullish, although its low component is neutral rather than a confirmed sequence of higher lows. The next opposite-pivot threshold is 164.77, distinct from established resistance at 171.82. Longer-term moving averages remain positively aligned, and price stands well above the 2026 annual neutral zone around 66–73. The required neutral grid entries above are placeholders rather than confirmation of neutral annual price positioning; weekly and monthly grids and the requested recent signal readings are not visible. No news or seasonal catalyst can be established from this image. USO is an oil-futures-linked fund, so its quoted levels are fund prices, not directly transferable crude-oil futures levels.
Chart Analysis ATS AI Generated: 2026-11-14 07:14 for Informational use only, not trading advice. Terms and Risk Disclosure Copyright © 2026. Algo Trading Systems LLC.