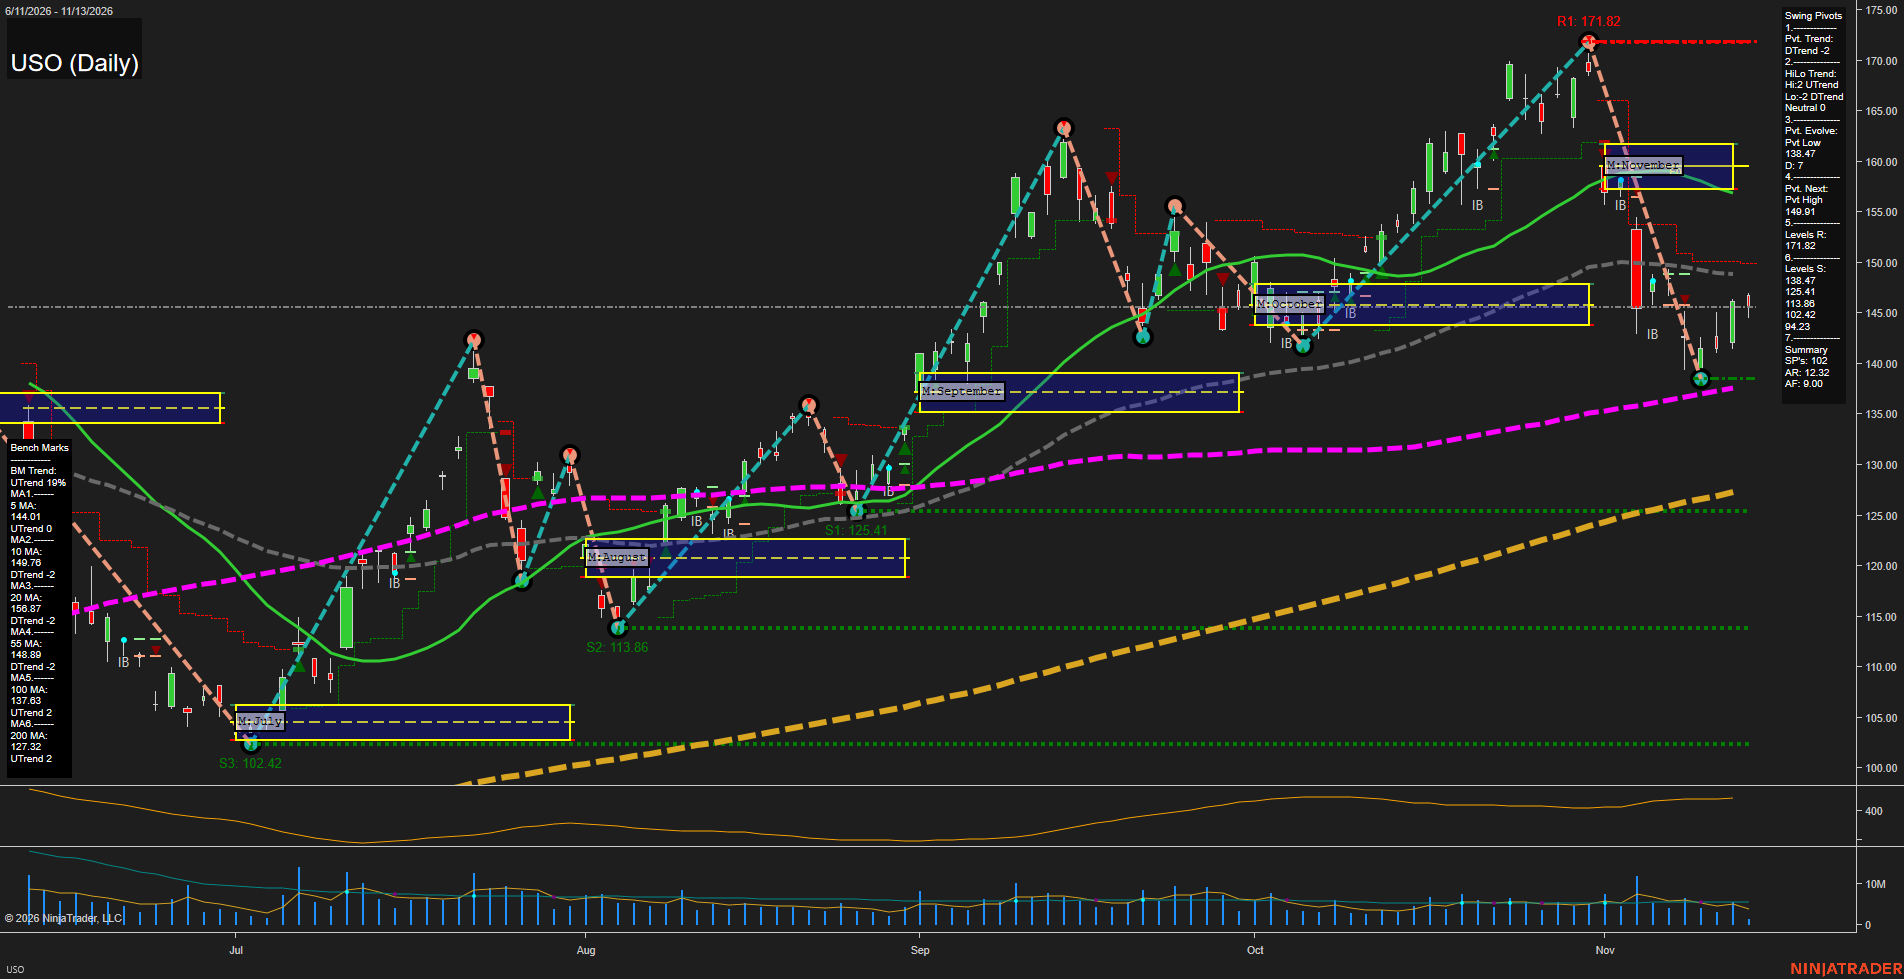
USO United States Oil Fund LP Daily Chart Analysis — Pre-Open: 2026-Nov-14 07:14 CT
Price Action
- Last: Approximately 146.00,
- Bars: Medium,
- Mom: Momentum slow.
WSFG Weekly
- Near-Term
- WSFG Current: NA%
- F0%/NTZ' Bias: Price Neutral,
- WSFG Trend: Neutral.
MSFG Month Nov
- Medium-Term
- MSFG Current: NA%
- F0%/NTZ' Bias: Price Bearish,
- MSFG Trend: Bearish.
YSFG Year 2026
- Far-Term
- YSFG Current: NA%
- F0%/NTZ' Bias: Price Neutral,
- YSFG Trend: Neutral.
Swing Pivots
- (Near-Term) 1. Pvt. Trend: DTrend,
- (Medium-Term) 2. HiLo Trend: Neutral,
- 3. Pvt. Evolve: Pvt low 138.47,
- 4. Pvt. Next: Pvt high 149.91,
- 5. Levels R: 171.82,
- 6. Levels S: 138.47, 125.41, 113.86, 102.42, 94.23.
Daily Benchmarks
- (Near-Term) 5 Day: 144.01 Up Trend,
- (Near-Term) 10 Day: 149.76 Down Trend,
- (Medium-Term) 20 Day: 156.87 Down Trend,
- (Medium-Term) 55 Day: 148.89 Down Trend,
- (Far-Term) 100 Day: 137.63 Up Trend,
- (Far-Term) 200 Day: 127.32 Up Trend.
Additional Metrics
- ATR: 138,
- VOLMA: 2577640.
Overall Rating
- Near-Term: Bearish,
- Medium-Term: Bearish,
- Far-Term: Bullish.
Key Insights Summary
From a futures swing trader’s perspective, USO shows a countertrend rebound within a sharp correction, rather than a confirmed bullish reversal. The decline from 171.82 reached 138.47 near the rising 100-day benchmark, followed by a recovery toward 146.00. Price has regained its 5-day average but remains below the declining 10-, 20- and 55-day benchmarks. The 148.89–149.91 area combines moving-average resistance with the next pivot-reversal threshold. November’s NTZ, approximately 157–162, remains overhead, reinforcing the bearish medium-term position. The pivot summary shows mixed medium-term structure, with rising highs and falling lows, consistent with expanding swings rather than an orderly trend. Rising 100- and 200-day averages preserve the bullish far-term backdrop. Weekly and yearly grids and the named trade-signal series are not visible; their neutral entries represent unavailable confirmation. ATR and VOLMA are supplied values rather than independently verified chart readings. USO is an oil ETF proxy, not a futures contract; contract-roll effects can produce differences from crude futures. News and seasonal influences cannot be established from this chart alone.
Chart Analysis ATS AI Generated: 2026-11-14 07:14 for Informational use only, not trading advice. Terms and Risk Disclosure Copyright © 2026. Algo Trading Systems LLC.