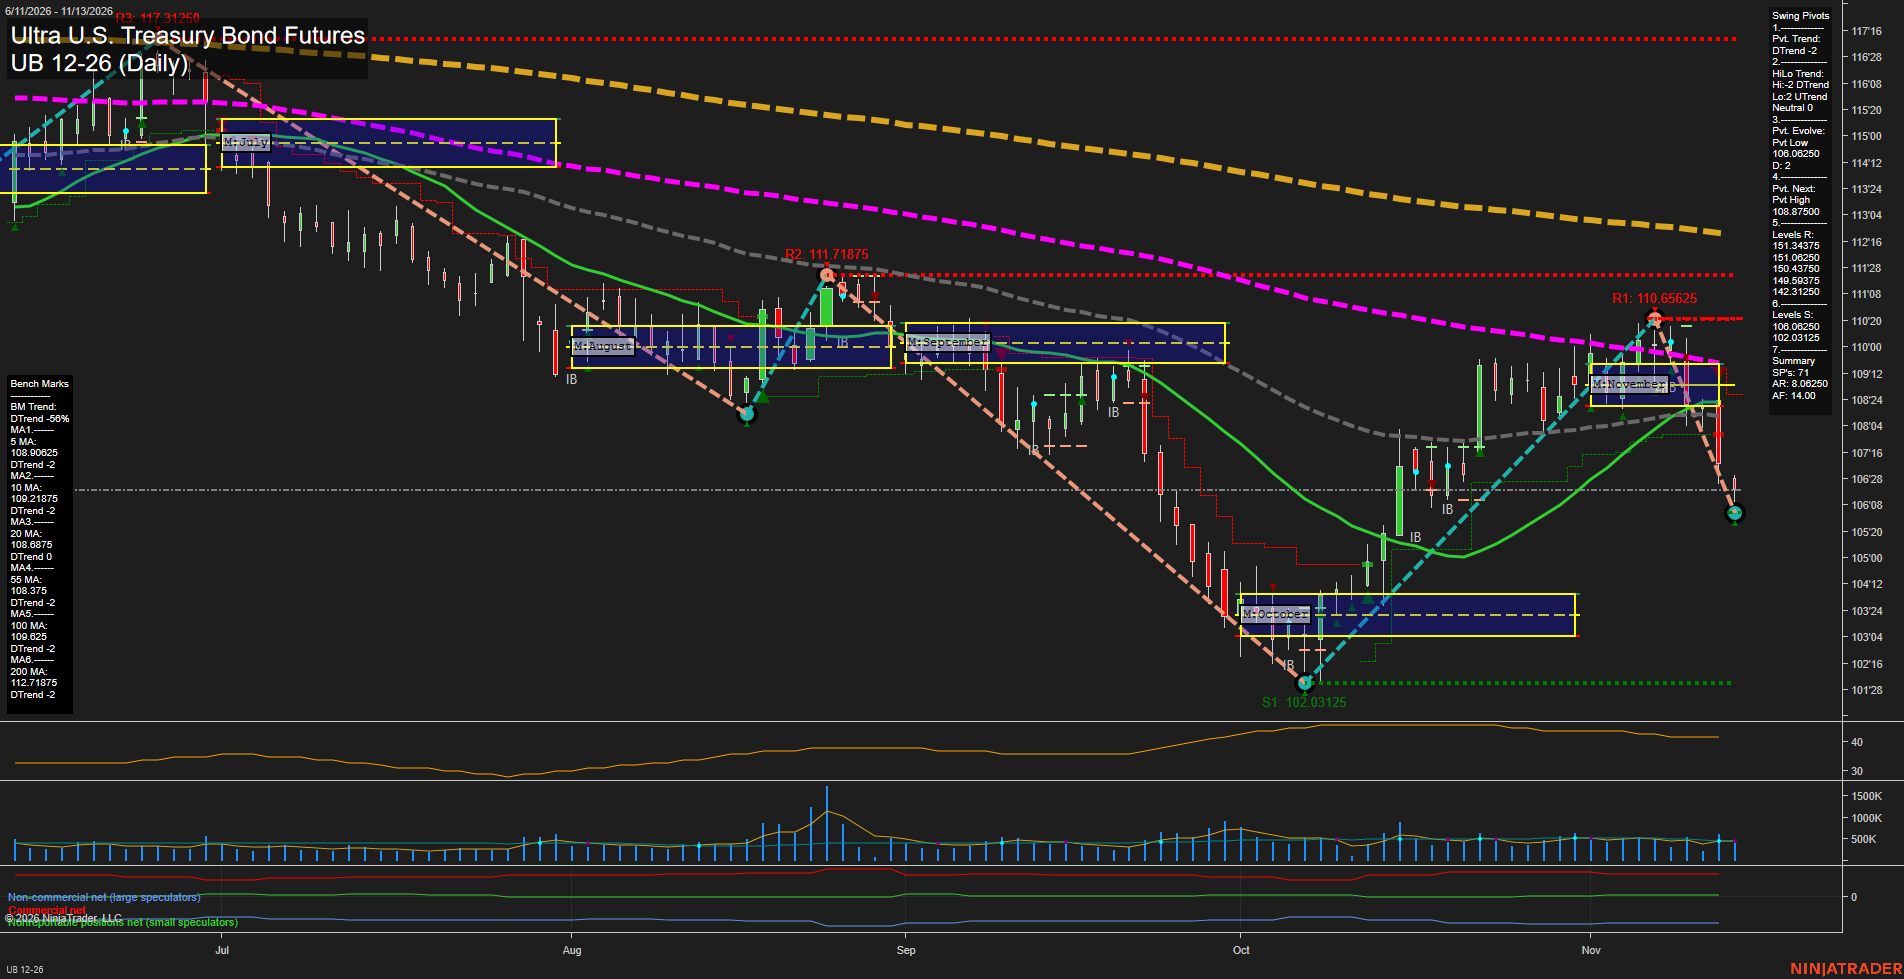
UB Ultra U.S. Treasury Bond Futures Daily Chart Analysis — Pre-Open: 2026-Nov-14 07:13 CT
Price Action
- Last: Approximately 106.6,
- Bars: Large,
- Mom: Momentum fast.
WSFG Weekly
- Near-Term
- WSFG Current: -110%
- F0%/NTZ' Bias: Price Below,
- WSFG Trend: Down.
MSFG Month Nov
- Medium-Term
- MSFG Current: -43%
- F0%/NTZ' Bias: Price Below,
- MSFG Trend: Down.
YSFG Year 2026
- Far-Term
- YSFG Current: -31%
- F0%/NTZ' Bias: Price Below,
- YSFG Trend: Down.
Swing Pivots
- (Near-Term) 1. Pvt. Trend: DTrend,
- (Medium-Term) 2. HiLo Trend: Neutral; highs DTrend, lows UTrend,
- 3. Pvt. Evolve: Pvt low 106.06250,
- 4. Pvt. Next: Pvt high 108.87500,
- 5. Levels R: 151.34375, 151.06250, 150.43750, 149.59375, 142.31250,
- 6. Levels S: 106.06250, 102.03125.
Daily Benchmarks
- (Near-Term) 5 Day: 108.90625 Down Trend,
- (Near-Term) 10 Day: 109.21875 Down Trend,
- (Medium-Term) 20 Day: 108.6875 Down Trend,
- (Medium-Term) 55 Day: 108.375 Down Trend,
- (Far-Term) 100 Day: 109.625 Down Trend,
- (Far-Term) 200 Day: 112.71875 Down Trend.
Additional Metrics
Recent Trade Signals
- 12 Nov 2026: Short UB 12-26 @ 107.25 Signals.USAR.TR720
- 12 Nov 2026: Short UB 12-26 @ 108.5 Signals.USAR-MSFG
- 10 Nov 2026: Short UB 12-26 @ 108.6875 Signals.USAR.TR120
Overall Rating
- Near-Term: Bearish,
- Medium-Term: Bearish,
- Far-Term: Bearish.
Key Insights Summary
The October rally has reversed sharply from the plotted 110.65625 swing high, leaving a lower high beneath August resistance at 111.71875. Large downside bars, a developing 106.06250 pivot low, and price below all six benchmarks favor a bearish swing-trend interpretation. The latest modest rebound has not reversed that structure. Medium-term pivots remain mixed because the current low is still above October's 102.03125 low, but the monthly grid breakdown and declining benchmarks outweigh that offset. Weekly, monthly, and yearly grid readings align with the supplied short signals across near-, medium-, and far-term horizons. The 108.375–109.21875 benchmark cluster marks overhead resistance. The summary's listed resistance values are inconsistent with the visible price scale; they are transcribed as displayed rather than substituted with plotted levels. News and seasonal catalysts cannot be established from this chart alone.
Chart Analysis ATS AI Generated: 2026-11-14 07:14 for Informational use only, not trading advice. Terms and Risk Disclosure Copyright © 2026. Algo Trading Systems LLC.