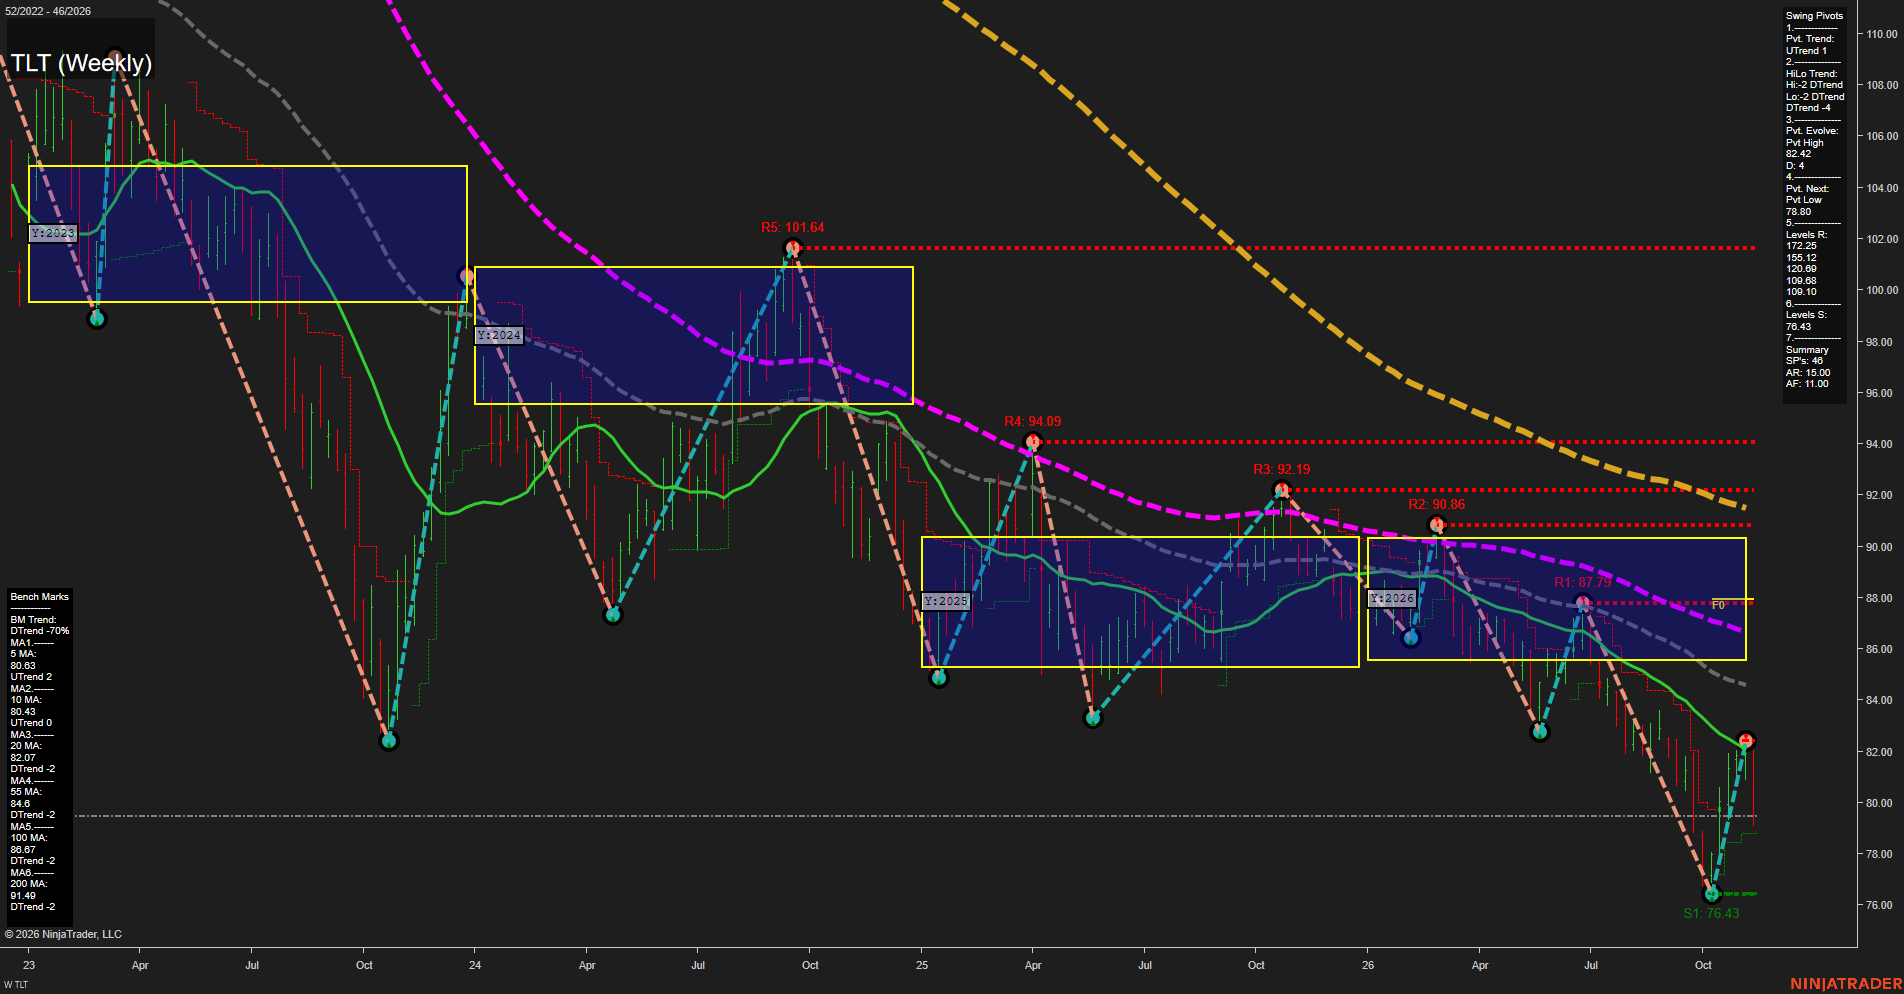
From a futures swing trader’s perspective, TLT shows a countertrend rebound within a persistent longer-term bond downtrend, rather than a confirmed bullish reversal. The recovery from 76.43 reached an evolving pivot high of 82.42, but the latest large bearish weekly bar has returned price below all six benchmarks. Rising 5- and 10-week averages and the upward pivot trend conflict with that renewed selling, leaving the near-term picture mixed. The 78.80 opposite-pivot threshold and 76.43 swing low define the nearby downside structure; 82.07–82.42 marks the immediate overhead benchmark/pivot area. Visible chart resistance at 87.79, 90.86, 92.19, 94.09 and 101.64 differs from the summary’s resistance inventory reproduced above. Price is also below the displayed yearly NTZ, approximately 85.6–90.3, and its center near 87.9, indicating bearish yearly positioning despite the neutral grid template entries. Weekly/monthly grids and the requested USAR signals are not displayed, so their direction cannot be verified. TLT provides a long-duration Treasury proxy, not a futures-contract price; news catalysts and seasonal influences are not established by this chart.