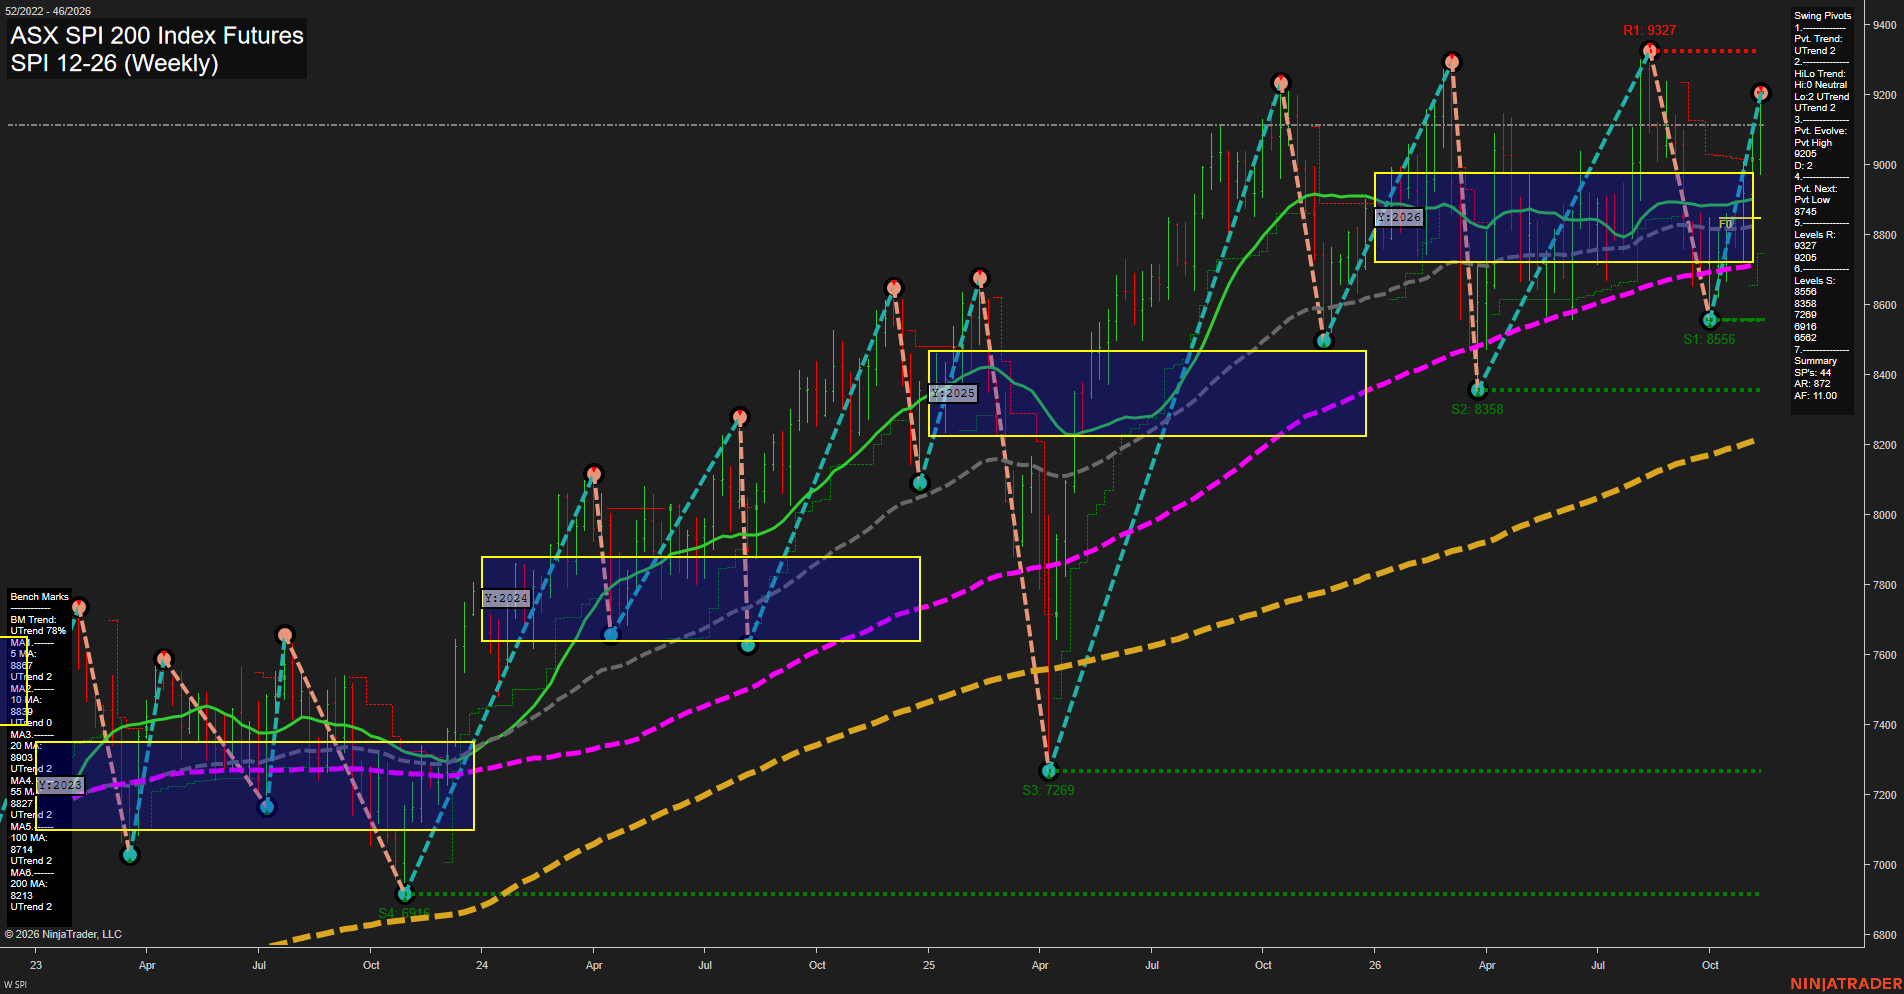
SPI ASX SPI 200 Index Futures Weekly Chart Analysis — Pre-Open: 2026-Nov-14 07:12 CT
Price Action
- Last: Approximately 9115,
- Bars: Large,
- Mom: Momentum fast.
WSFG Weekly
- Near-Term
- WSFG Current: NA%
- F0%/NTZ' Bias: Price Neutral,
- WSFG Trend: Neutral.
MSFG Month Nov
- Medium-Term
- MSFG Current: NA%
- F0%/NTZ' Bias: Price Neutral,
- MSFG Trend: Neutral.
YSFG Year 2026
- Far-Term
- YSFG Current: NA%
- F0%/NTZ' Bias: Price Neutral,
- YSFG Trend: Neutral.
Swing Pivots
- (Near-Term) 1. Pvt. Trend: UTrend,
- (Medium-Term) 2. HiLo Trend: UTrend,
- 3. Pvt. Evolve: Pvt high 9205,
- 4. Pvt. Next: Pvt low 8745,
- 5. Levels R: 9327, 9205,
- 6. Levels S: 8556, 8358, 7269, 6916, 6562.
Weekly Benchmarks
- (Near-Term) 5 Week: Approximately 8867 Up Trend,
- (Near-Term) 10 Week: 8839 Up Trend,
- (Medium-Term) 20 Week: 8903 Up Trend,
- (Medium-Term) 55 Week: 8827 Up Trend,
- (Far-Term) 100 Week: 8714 Up Trend,
- (Far-Term) 200 Week: 8213 Up Trend.
Overall Rating
- Near-Term: Bullish,
- Medium-Term: Bullish,
- Far-Term: Bullish.
Key Insights Summary
The weekly structure shows a sharp recovery from 8556 toward an evolving swing high at 9205, with price approximately 9115 and above all six benchmarks. The higher low at 8556 versus 8358 supports the medium-term uptrend, although the latest evolving high remains below 9327, leaving overhead resistance intact. The pivot summary shows neutral highs and rising lows, consistent with recovery inside a broader consolidation rather than a confirmed upside breakout. Rising 100- and 200-week benchmarks support the longer-term bullish structure. Price is visibly above the 2026 yellow NTZ upper boundary; the neutral session-grid entries are placeholders because explicit grid-trend readings are unavailable. Recent named trade-signal readings, news catalysts and seasonal confirmation are not displayed and are excluded from the ratings.
Chart Analysis ATS AI Generated: 2026-11-14 07:12 for Informational use only, not trading advice. Terms and Risk Disclosure Copyright © 2026. Algo Trading Systems LLC.