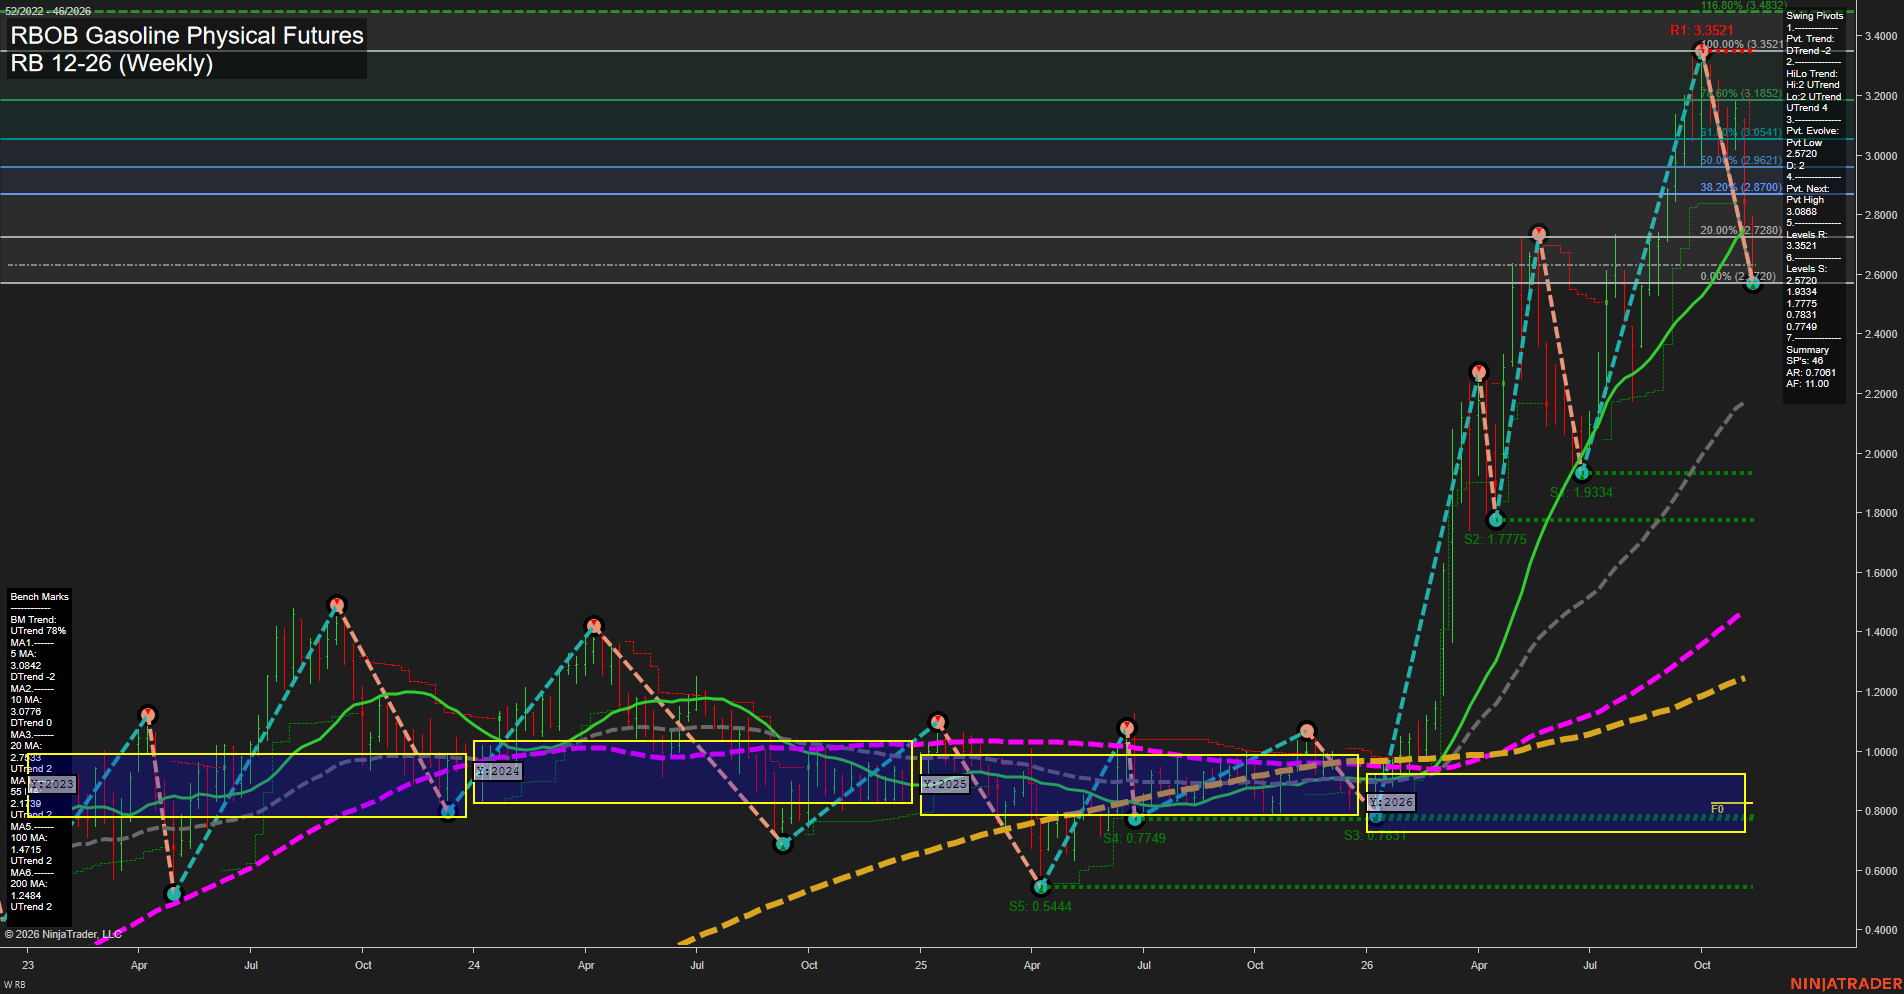
RB RBOB Gasoline Physical Futures Weekly Chart Analysis — Pre-Open: 2026-Nov-14 07:11 CT
Price Action
- Last: Approximately 2.63,
- Bars: Large,
- Mom: Momentum fast.
WSFG Weekly
- Near-Term
- WSFG Current: -56%
- F0%/NTZ' Bias: Price Below,
- WSFG Trend: Down.
MSFG Month Nov
- Medium-Term
- MSFG Current: -100%
- F0%/NTZ' Bias: Price Below,
- MSFG Trend: Down.
YSFG Year 2026
- Far-Term
- YSFG Current: 186%
- F0%/NTZ' Bias: Price Above,
- YSFG Trend: Up.
Swing Pivots
- (Near-Term) 1. Pvt. Trend: DTrend,
- (Medium-Term) 2. HiLo Trend: UTrend,
- 3. Pvt. Evolve: Pvt low 2.5720,
- 4. Pvt. Next: Pvt high 3.0868,
- 5. Levels R: 3.3521,
- 6. Levels S: 2.5720, 1.9334, 1.7775, 0.7831, 0.7749.
Weekly Benchmarks
- (Near-Term) 5 Week: 3.0842 Down Trend,
- (Near-Term) 10 Week: 3.0776 Down Trend,
- (Medium-Term) 20 Week: 2.7583 Up Trend,
- (Medium-Term) 55 Week: 2.1789 Up Trend,
- (Far-Term) 100 Week: 1.4715 Up Trend,
- (Far-Term) 200 Week: 1.2484 Up Trend.
Recent Trade Signals
- 09 Nov 2026: Short RB 12-26 @ 2.7419 Signals.USAR-WSFG
Overall Rating
- Near-Term: Bearish,
- Medium-Term: Bullish,
- Far-Term: Bullish.
Key Insights Summary
The weekly structure shows a sharp countertrend decline within the larger 2026 advance. Large bars and the fall from 3.3521 to an evolving 2.5720 pivot low indicate strong downside momentum and elevated volatility. The bearish weekly and monthly grids, falling 5- and 10-week benchmarks, and recent short signal reinforce near-term weakness. Medium-term structure remains bullish on balance because the high/low pivot trend and both medium-term benchmarks still rise, although price below the 20-week benchmark confirms meaningful deterioration. The 2.5720 pivot is the nearest support reference; 3.0868 is the stated next-pivot reversal threshold, with major resistance at 3.3521. Rising 100- and 200-week benchmarks and the positive yearly grid preserve the far-term bullish backdrop. Seasonal gasoline-demand softness offers context for a November retracement, but the chart alone does not establish a news catalyst.
Chart Analysis ATS AI Generated: 2026-11-14 07:11 for Informational use only, not trading advice. Terms and Risk Disclosure Copyright © 2026. Algo Trading Systems LLC.