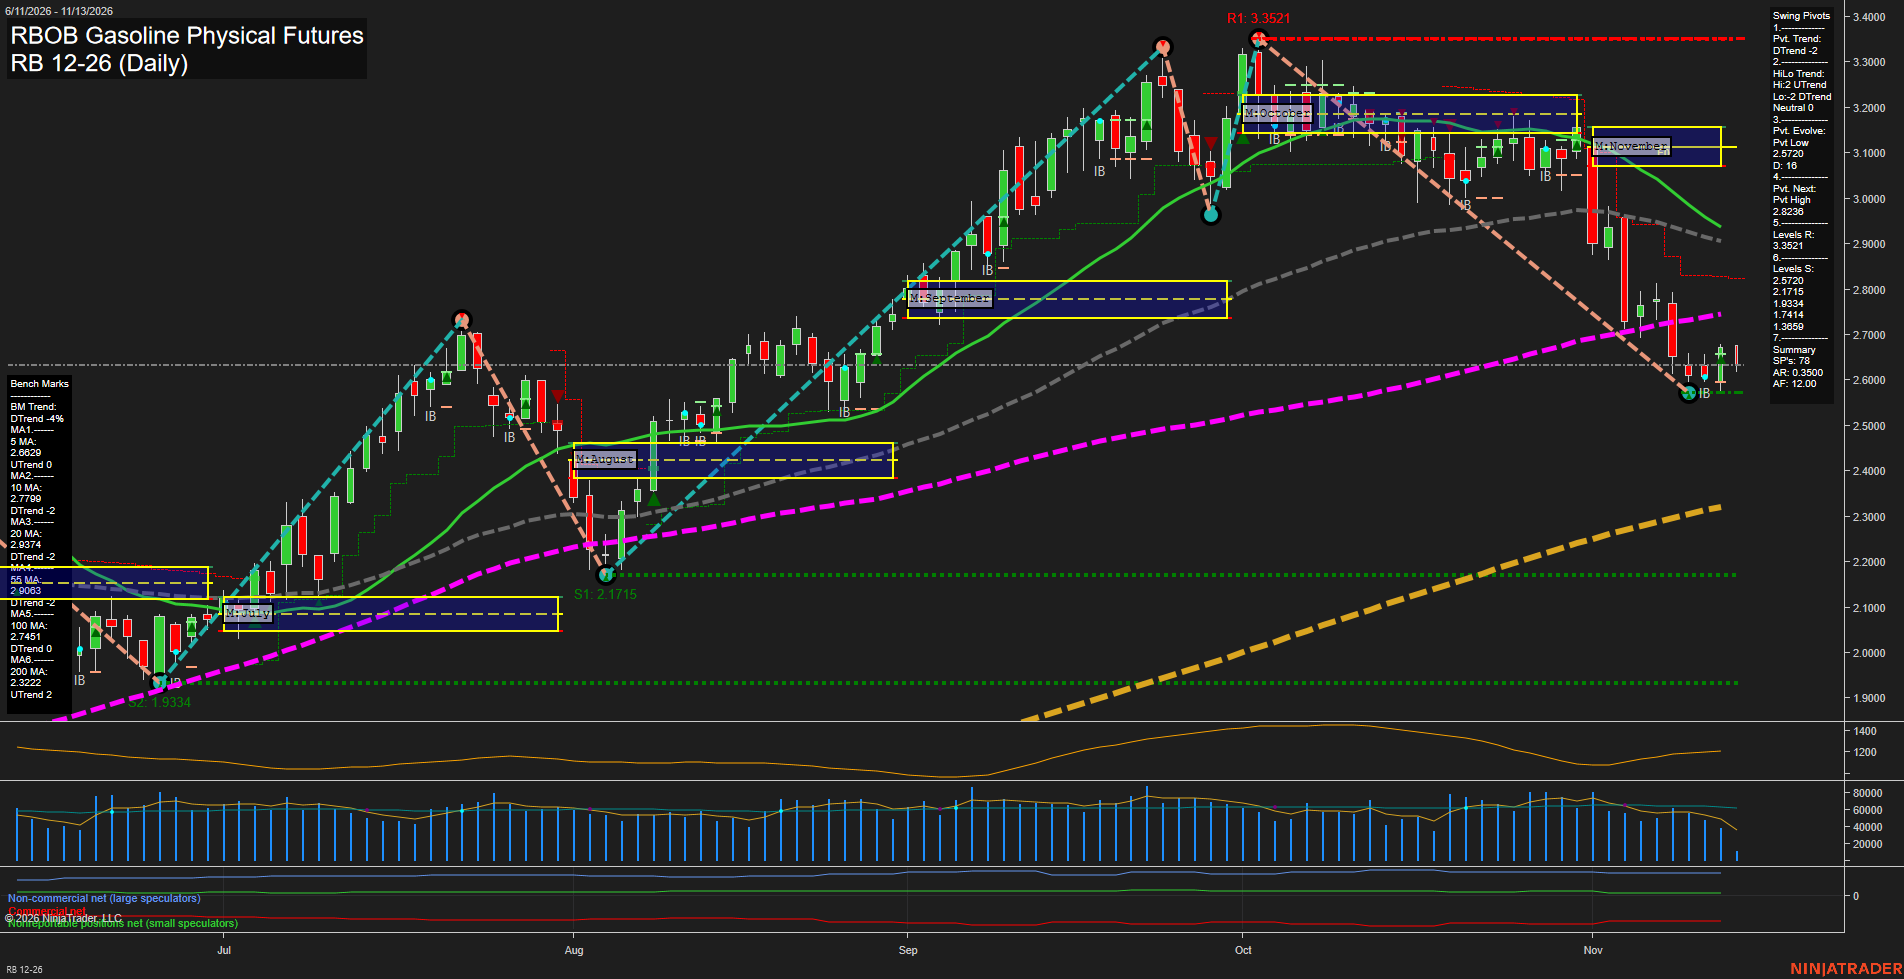
RB RBOB Gasoline Physical Futures Daily Chart Analysis — Pre-Open: 2026-Nov-14 07:10 CT
Price Action
- Last: Approximately 2.6320,
- Bars: Small,
- Mom: Momentum slow.
WSFG Weekly
- Near-Term
- WSFG Current: -56%
- F0%/NTZ' Bias: Price Below,
- WSFG Trend: Down.
MSFG Month Nov
- Medium-Term
- MSFG Current: -100%
- F0%/NTZ' Bias: Price Below,
- MSFG Trend: Down.
YSFG Year 2026
- Far-Term
- YSFG Current: 186%
- F0%/NTZ' Bias: Price Above,
- YSFG Trend: Up.
Swing Pivots
- (Near-Term) 1. Pvt. Trend: DTrend,
- (Medium-Term) 2. HiLo Trend: Neutral,
- 3. Pvt. Evolve: Pvt low 2.5720,
- 4. Pvt. Next: Pvt high 2.8236,
- 5. Levels R: 3.3521,
- 6. Levels S: 2.5720, 2.1715, 1.9334, 1.7414, 1.3659.
Daily Benchmarks
- (Near-Term) 5 Day: 2.6629 Up Trend,
- (Near-Term) 10 Day: 2.7799 Down Trend,
- (Medium-Term) 20 Day: 2.9374 Down Trend,
- (Medium-Term) 55 Day: 2.9063 Down Trend,
- (Far-Term) 100 Day: 2.7451 Down Trend,
- (Far-Term) 200 Day: 2.3222 Up Trend.
Additional Metrics
Recent Trade Signals
- 09 Nov 2026: Short RB 12-26 @ 2.7419 Signals.USAR-WSFG
Overall Rating
- Near-Term: Bearish,
- Medium-Term: Bearish,
- Far-Term: Bullish.
Key Insights Summary
The dominant swing is a sharp correction from the October 3.3521 high toward the evolving 2.5720 pivot low. Recent small candles indicate slowing momentum and consolidation near the lows, rather than a confirmed upside reversal. The rising five-day benchmark offers an early stabilization signal, but price remains below both near-term averages and the declining 20-, 55- and 100-day benchmarks. Weekly and monthly grid weakness reinforces the bearish near- and medium-term picture. The pivot summary reports a neutral medium-term HiLo structure, reflecting conflicting high and low trends; 2.8236 is the stated opposite-pivot reversal threshold. Far-term conditions remain bullish on balance because the yearly grid and rising 200-day benchmark outweigh the declining 100-day benchmark, although the longer-term picture is mixed. November gasoline seasonality can provide a softer demand backdrop, but the chart alone does not establish a news-driven cause for this selloff.
Chart Analysis ATS AI Generated: 2026-11-14 07:11 for Informational use only, not trading advice. Terms and Risk Disclosure Copyright © 2026. Algo Trading Systems LLC.