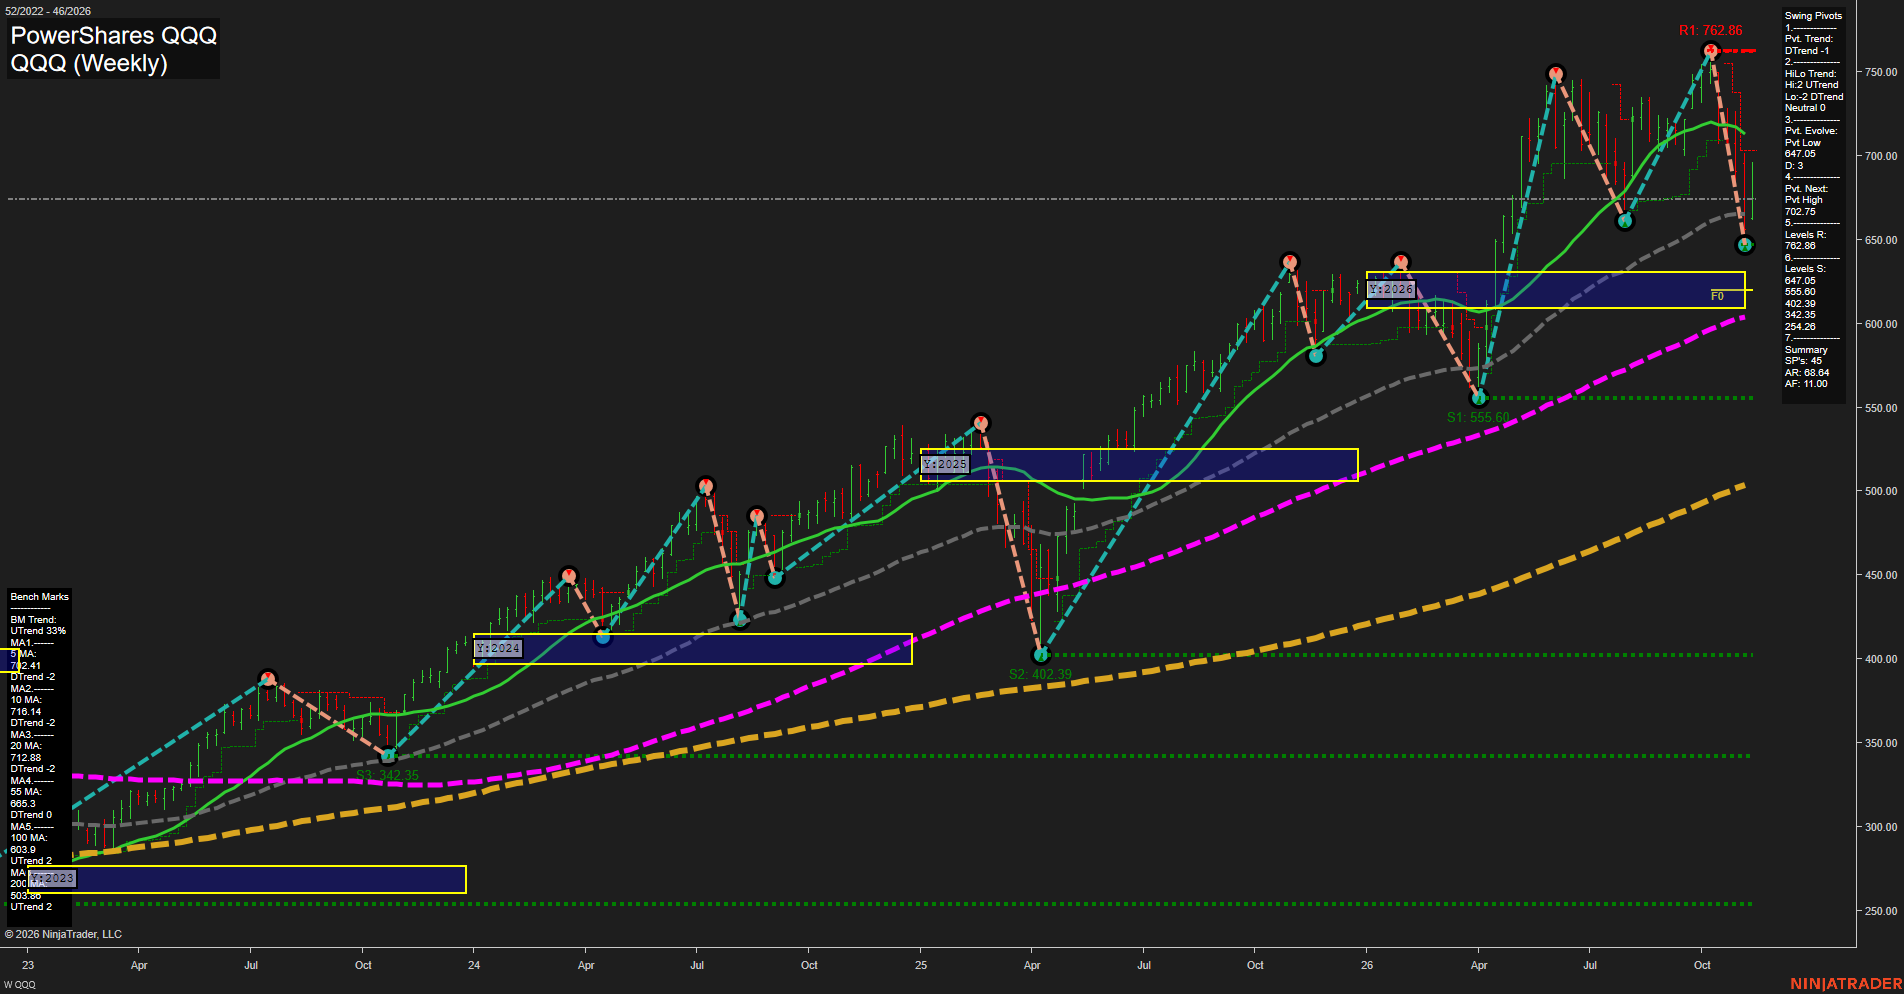
QQQ PowerShares QQQ Weekly Chart Analysis — Pre-Open: 2026-Nov-14 07:10 CT
Price Action
- Last: Approximately 650,
- Bars: Large,
- Mom: Momentum fast.
WSFG Weekly
- Near-Term
- WSFG Current: NA%
- F0%/NTZ' Bias: Price Neutral,
- WSFG Trend: Neutral.
MSFG Month Nov
- Medium-Term
- MSFG Current: NA%
- F0%/NTZ' Bias: Price Neutral,
- MSFG Trend: Neutral.
YSFG Year 2026
- Far-Term
- YSFG Current: NA%
- F0%/NTZ' Bias: Price Neutral,
- YSFG Trend: Neutral.
Swing Pivots
- (Near-Term) 1. Pvt. Trend: DTrend,
- (Medium-Term) 2. HiLo Trend: Neutral,
- 3. Pvt. Evolve: Pvt low 647.05,
- 4. Pvt. Next: Pvt high 702.75,
- 5. Levels R: 762.86,
- 6. Levels S: 647.05, 555.60, 402.39, 342.35, 254.26.
Weekly Benchmarks
- (Near-Term) 5 Week: 702.41 Down Trend,
- (Near-Term) 10 Week: 716.14 Down Trend,
- (Medium-Term) 20 Week: 712.88 Down Trend,
- (Medium-Term) 55 Week: 665.30 Down Trend,
- (Far-Term) 100 Week: 603.90 Up Trend,
- (Far-Term) 200 Week: 503.38 Up Trend.
Overall Rating
- Near-Term: Bearish,
- Medium-Term: Bearish,
- Far-Term: Bullish.
Key Insights Summary
From a futures swing trader’s perspective, QQQ shows an accelerated downside swing within a still-rising long-term structure. The reversal from 762.86 to the evolving 647.05 pivot low represents approximately a 15% retracement, with price below all four shorter weekly benchmarks. The pivot summary records higher highs but lower lows, producing a neutral HiLo trend and an expanding, volatile structure rather than an orderly trend continuation. The 702.75 next-pivot threshold identifies the chart’s upside reversal reference. Price remains above the rising 100- and 200-week averages and approximately above the 2026 yearly NTZ, near 610–631, preserving the distinction between near-term weakness and long-term strength. Weekly and monthly grids and the named recent trade signals are not displayed; their neutral placeholders are not confirmed readings. No news or seasonal catalyst can be established from this chart. These are QQQ reference prices, not Nasdaq futures contract levels.
Chart Analysis ATS AI Generated: 2026-11-14 07:10 for Informational use only, not trading advice. Terms and Risk Disclosure Copyright © 2026. Algo Trading Systems LLC.