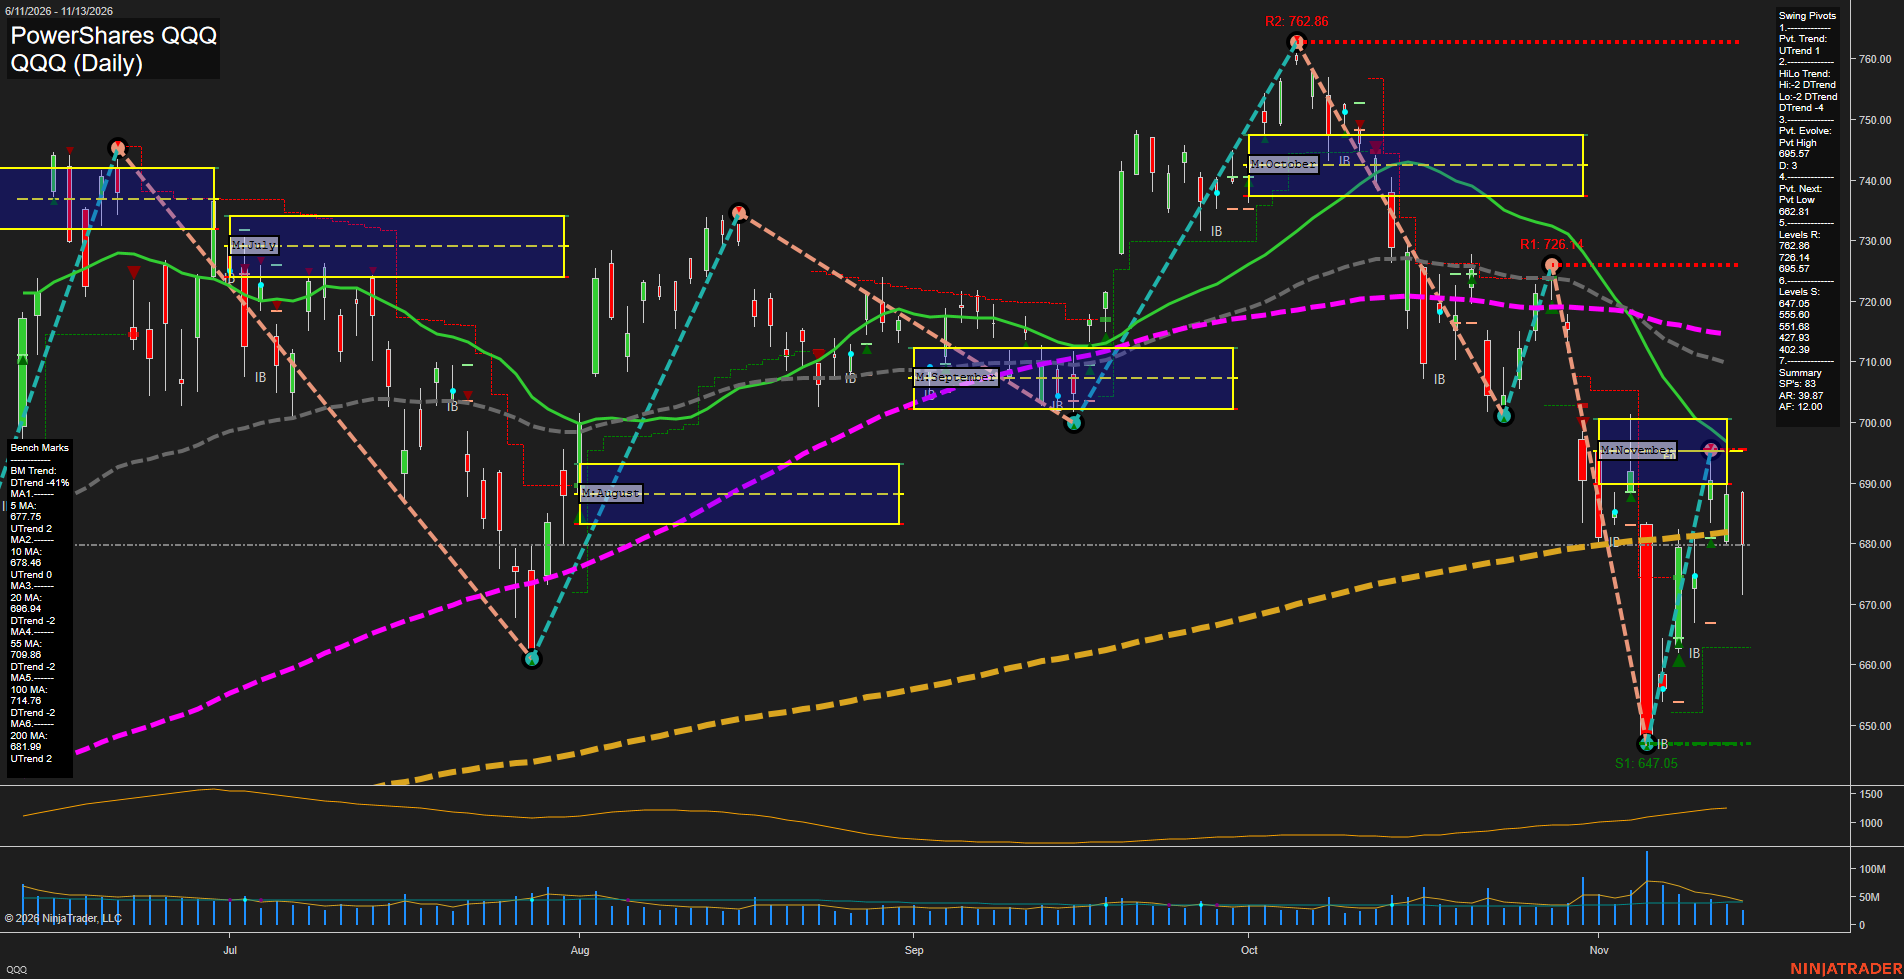
QQQ PowerShares QQQ Daily Chart Analysis — Pre-Open: 2026-Nov-14 07:10 CT
Price Action
- Last: Approximately 680.00,
- Bars: Large,
- Mom: Fast, with sharp two-way swings.
WSFG Weekly
- Near-Term
- WSFG Current: NA%
- F0%/NTZ' Bias: Price Neutral,
- WSFG Trend: Neutral.
MSFG Month Nov
- Medium-Term
- MSFG Current: NA%
- F0%/NTZ' Bias: Price Neutral,
- MSFG Trend: Neutral.
YSFG Year 2026
- Far-Term
- YSFG Current: NA%
- F0%/NTZ' Bias: Price Neutral,
- YSFG Trend: Neutral.
Swing Pivots
- (Near-Term) 1. Pvt. Trend: UTrend,
- (Medium-Term) 2. HiLo Trend: DTrend,
- 3. Pvt. Evolve: Pvt high 695.57,
- 4. Pvt. Next: Pvt low 662.81,
- 5. Levels R: 762.86, 726.14, 695.57,
- 6. Levels S: 647.05, 555.60, 551.68, 427.93, 402.39.
Daily Benchmarks
- (Near-Term) 5 Day: 677.75 Up Trend,
- (Near-Term) 10 Day: 678.46 Up Trend,
- (Medium-Term) 20 Day: 696.94 Down Trend,
- (Medium-Term) 55 Day: 709.86 Down Trend,
- (Far-Term) 100 Day: 714.76 Down Trend,
- (Far-Term) 200 Day: 681.99 Up Trend.
Additional Metrics
- ATR: 733,
- VOLMA: 32709273.
Overall Rating
- Near-Term: Bullish,
- Medium-Term: Bearish,
- Far-Term: Neutral.
Key Insights Summary
From a futures swing trader’s perspective, QQQ shows a near-term recovery inside a broader corrective structure, rather than a confirmed sustained reversal. The rebound from 647.05 established an upward pivot trend and rising 5- and 10-day benchmarks, but the rejection around 695.57 leaves a lower high beneath 726.14 and 762.86. Price has retreated below November’s approximately 690–700 neutral zone and is testing the rising 200-day benchmark near 681.99. Falling 20-, 55-, and 100-day benchmarks reinforce the medium-term bearish backdrop. Large daily ranges and long wicks indicate volatile, two-way price discovery; the latest rebound has not repaired the sequence of lower highs and lower lows. The next opposite-pivot threshold is 662.81, while 647.05 remains the nearest listed structural support. These are QQQ reference prices, not Nasdaq futures contract levels. Weekly and yearly grids, named trade-signal readings, and news catalysts are not visible, so they cannot independently confirm the technical assessment.
Chart Analysis ATS AI Generated: 2026-11-14 07:10 for Informational use only, not trading advice. Terms and Risk Disclosure Copyright © 2026. Algo Trading Systems LLC.