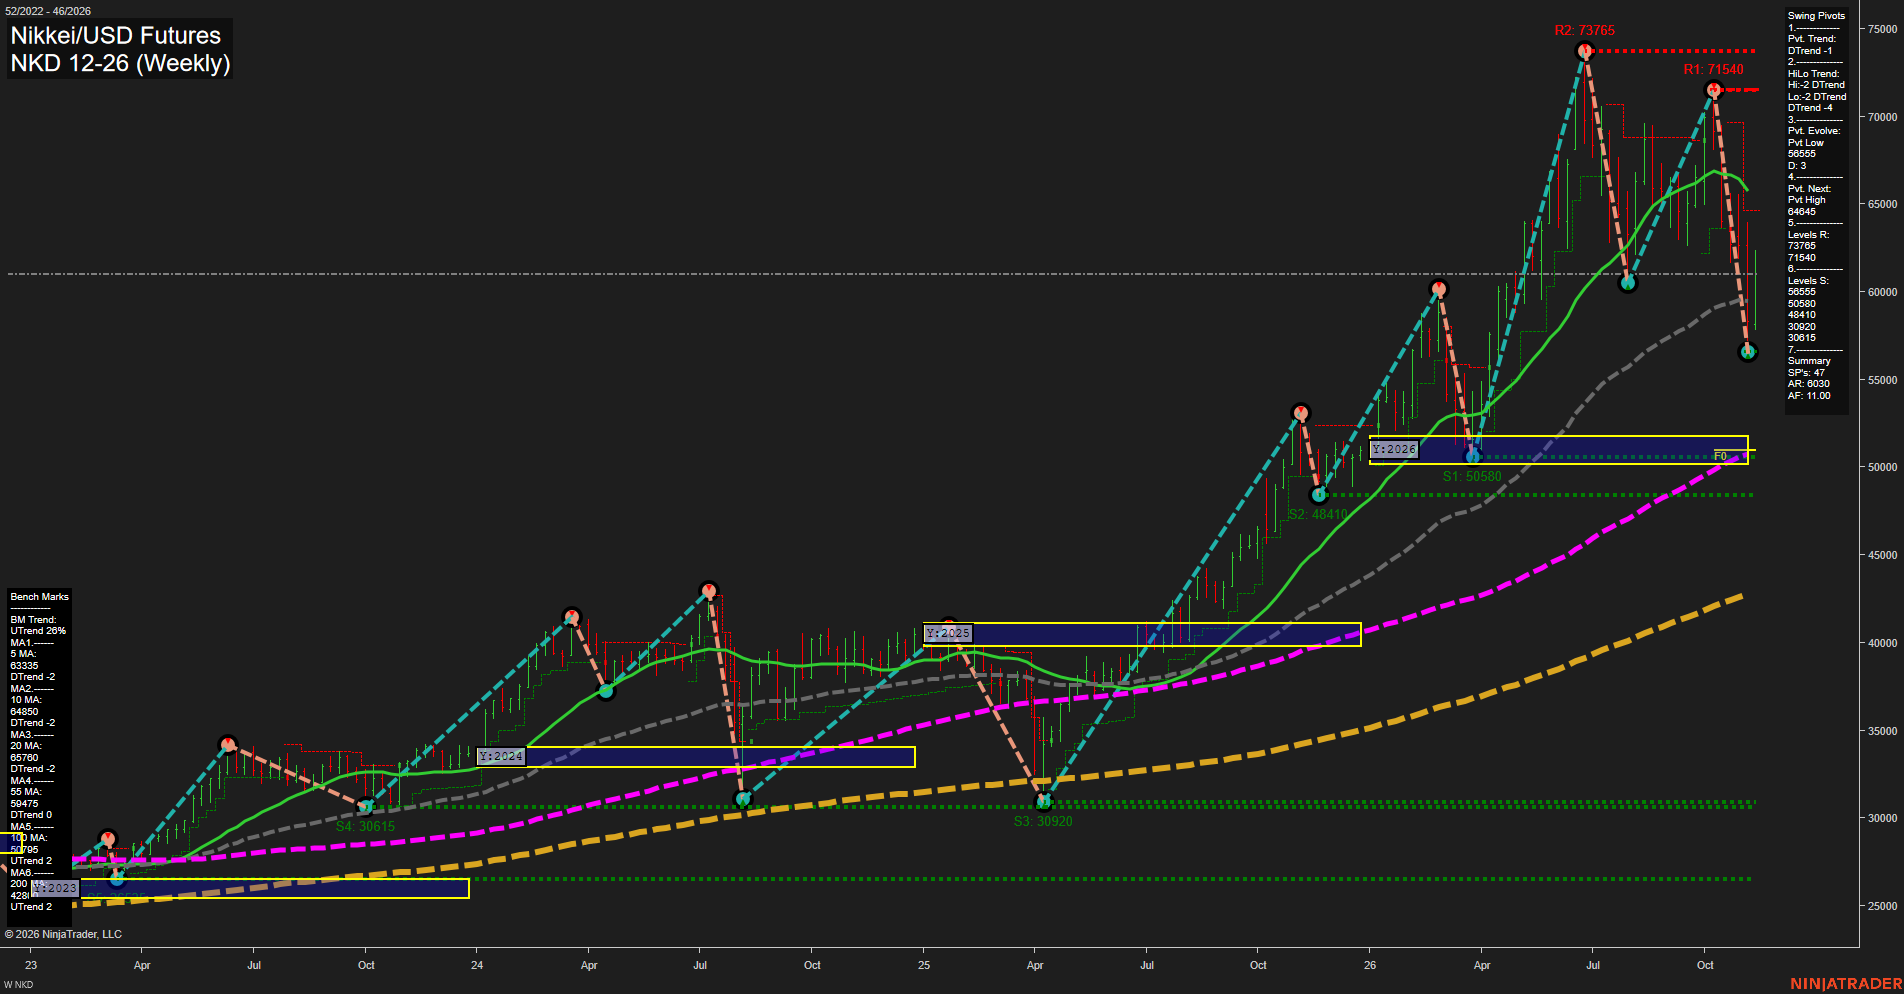
NKD Nikkei/USD Futures Weekly Chart Analysis — Pre-Open: 2026-Nov-14 07:09 CT
Price Action
- Last: Approximately 61,000,
- Bars: Large,
- Mom: Fast downside momentum with a developing rebound.
WSFG Weekly
- Near-Term
- WSFG Current: 59%
- F0%/NTZ' Bias: Price Above,
- WSFG Trend: Up.
MSFG Month Nov
- Medium-Term
- MSFG Current: -20%
- F0%/NTZ' Bias: Price Below,
- MSFG Trend: Down.
YSFG Year 2026
- Far-Term
- YSFG Current: 124%
- F0%/NTZ' Bias: Price Above,
- YSFG Trend: Up.
Swing Pivots
- (Near-Term) 1. Pvt. Trend: DTrend,
- (Medium-Term) 2. HiLo Trend: DTrend,
- 3. Pvt. Evolve: Pvt low 56555,
- 4. Pvt. Next: Pvt high 64645,
- 5. Levels R: 73765, 71540,
- 6. Levels S: 56555, 50580, 48410, 30920, 30615.
Weekly Benchmarks
- (Near-Term) 5 Week: 63335 Down Trend,
- (Near-Term) 10 Week: 64850 Down Trend,
- (Medium-Term) 20 Week: 65760 Down Trend,
- (Medium-Term) 55 Week: 59475 Down Trend,
- (Far-Term) 100 Week: 50795 Up Trend,
- (Far-Term) 200 Week: Approximately 42800 Up Trend.
Overall Rating
- Near-Term: Bearish,
- Medium-Term: Bearish,
- Far-Term: Bullish.
Key Insights Summary
The swing-trading picture is a sharp correction within a still-rising long-term structure. The lower high at 71540 versus 73765 and the subsequent decline to 56555 establish bearish pivot sequencing. A rebound toward approximately 61000 has recovered the 55-week benchmark, but price remains below the declining 5-, 10- and 20-week averages. Weekly grid strength therefore represents a near-term countertrend recovery rather than a confirmed reversal of the broader correction; the next pivot reversal threshold is 64645. Support is concentrated at 56555, followed by the 50580–48410 region, with the yearly NTZ and rising 100-week average nearby. Large weekly ranges indicate elevated volatility and two-way price discovery. The rising 100- and 200-week benchmarks and positive yearly grid preserve the far-term bullish backdrop despite near- and medium-term weakness. Recent named trade signals, news catalysts and seasonal evidence are not displayed and are not inferred.
Chart Analysis ATS AI Generated: 2026-11-14 07:09 for Informational use only, not trading advice. Terms and Risk Disclosure Copyright © 2026. Algo Trading Systems LLC.