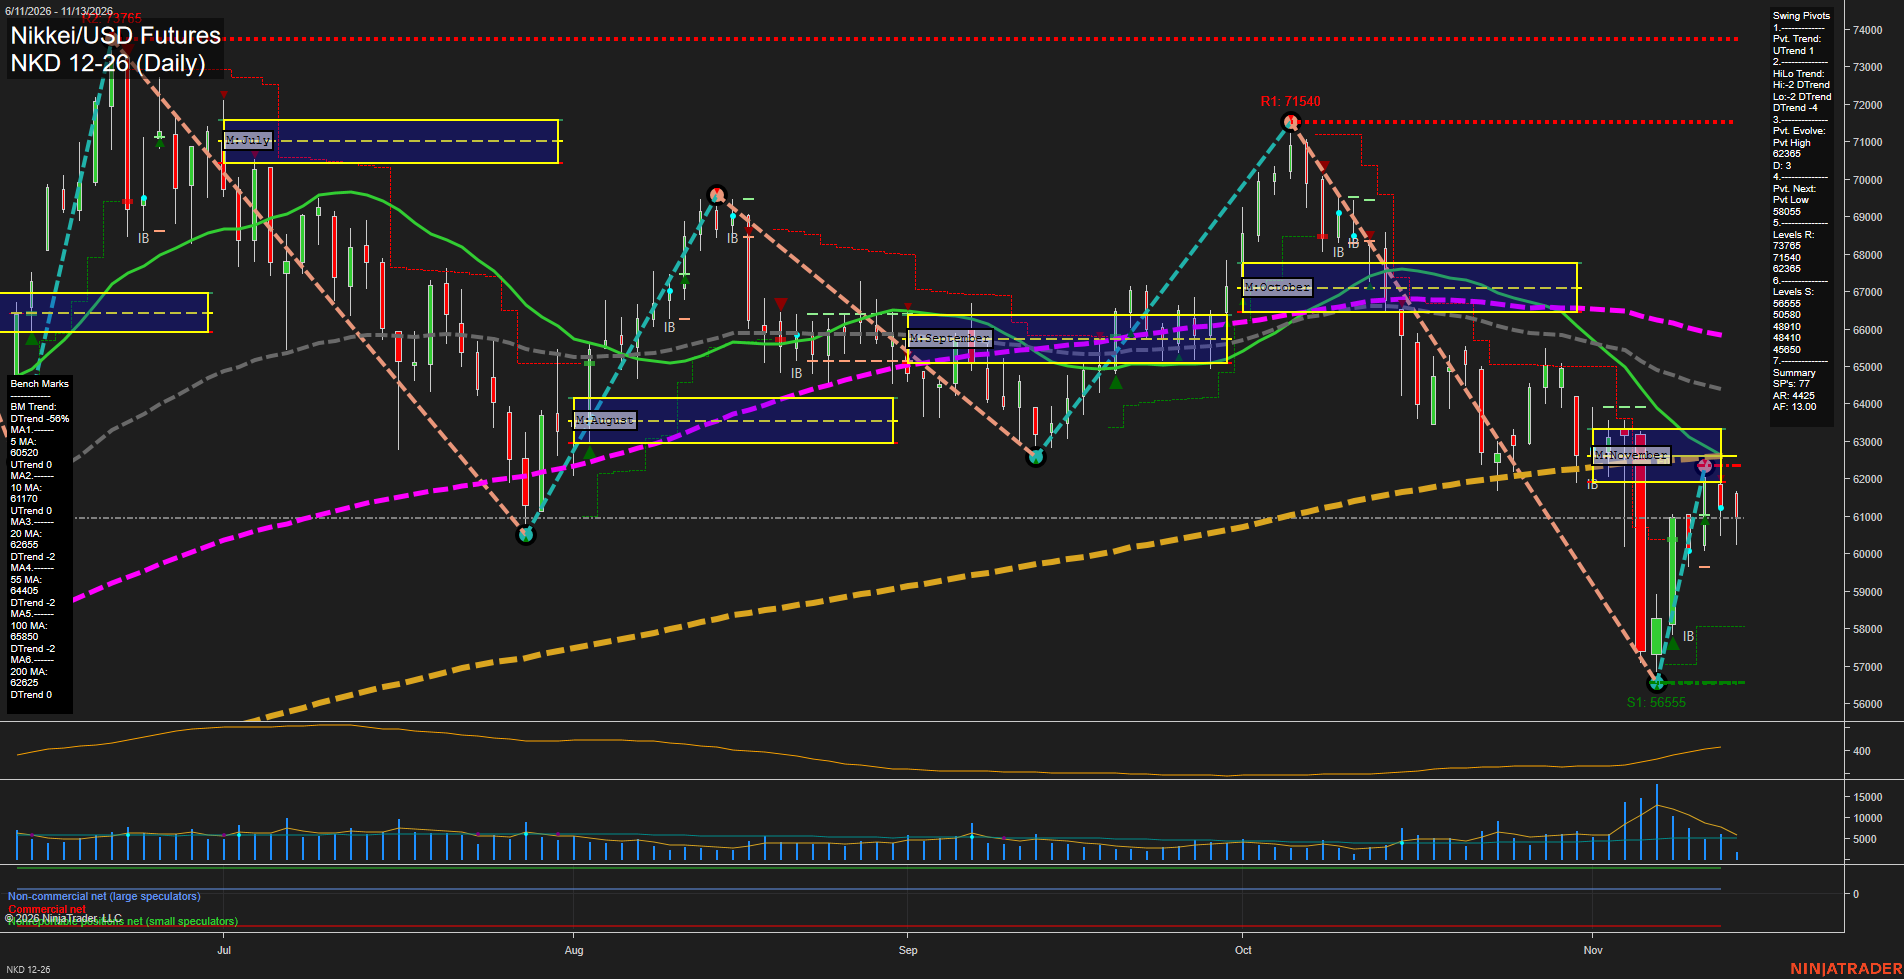
NKD Nikkei/USD Futures Daily Chart Analysis — Pre-Open: 2026-Nov-14 07:09 CT
Price Action
- Last: Approximately 61,000,
- Bars: Medium,
- Mom: Momentum slow.
WSFG Weekly
- Near-Term
- WSFG Current: 59%
- F0%/NTZ' Bias: Price Above,
- WSFG Trend: Up.
MSFG Month Nov
- Medium-Term
- MSFG Current: -20%
- F0%/NTZ' Bias: Price Below,
- MSFG Trend: Down.
YSFG Year 2026
- Far-Term
- YSFG Current: 124%
- F0%/NTZ' Bias: Price Above,
- YSFG Trend: Up.
Swing Pivots
- (Near-Term) 1. Pvt. Trend: UTrend,
- (Medium-Term) 2. HiLo Trend: DTrend,
- 3. Pvt. Evolve: Pvt high 62,365,
- 4. Pvt. Next: Pvt low 58,055,
- 5. Levels R: 73,765, 71,540, 62,365,
- 6. Levels S: 56,555, 50,580, 48,910, 48,410, 45,650.
Daily Benchmarks
- (Near-Term) 5 Day: 60,520 Up Trend,
- (Near-Term) 10 Day: 61,170 Up Trend,
- (Medium-Term) 20 Day: 62,655 Down Trend,
- (Medium-Term) 55 Day: 64,405 Down Trend,
- (Far-Term) 100 Day: 65,850 Down Trend,
- (Far-Term) 200 Day: 62,625 Down Trend.
Additional Metrics
Overall Rating
- Near-Term: Bullish,
- Medium-Term: Bearish,
- Far-Term: Bearish.
Key Insights Summary
The rebound from 56,555 to the evolving 62,365 pivot high represents a near-term countertrend recovery within a broader declining swing structure. Weekly grid strength, the upward pivot trend, and rising 5- and 10-day benchmarks support the bullish near-term rating, although the latest retreat toward 61,000 shows fading rebound momentum. Price remains below November’s NTZ and the declining 20-, 55-, 100- and 200-day benchmarks. Resistance clusters around 62,365–62,655, where the recovery meets the longer benchmarks and monthly balance area. The 58,055 reversal threshold and 56,555 swing low define important downside reference levels. The positive yearly grid contrasts with bearish far-term moving-average trends, indicating a substantial retracement within the year's broader advance. Volume expanded during the sharp selloff and has subsequently contracted, consistent with an easing recovery rather than sustained upside acceleration. Recent named trade-signal readings, news catalysts and seasonal evidence are not supplied, so they are not inferred.
Chart Analysis ATS AI Generated: 2026-11-14 07:09 for Informational use only, not trading advice. Terms and Risk Disclosure Copyright © 2026. Algo Trading Systems LLC.