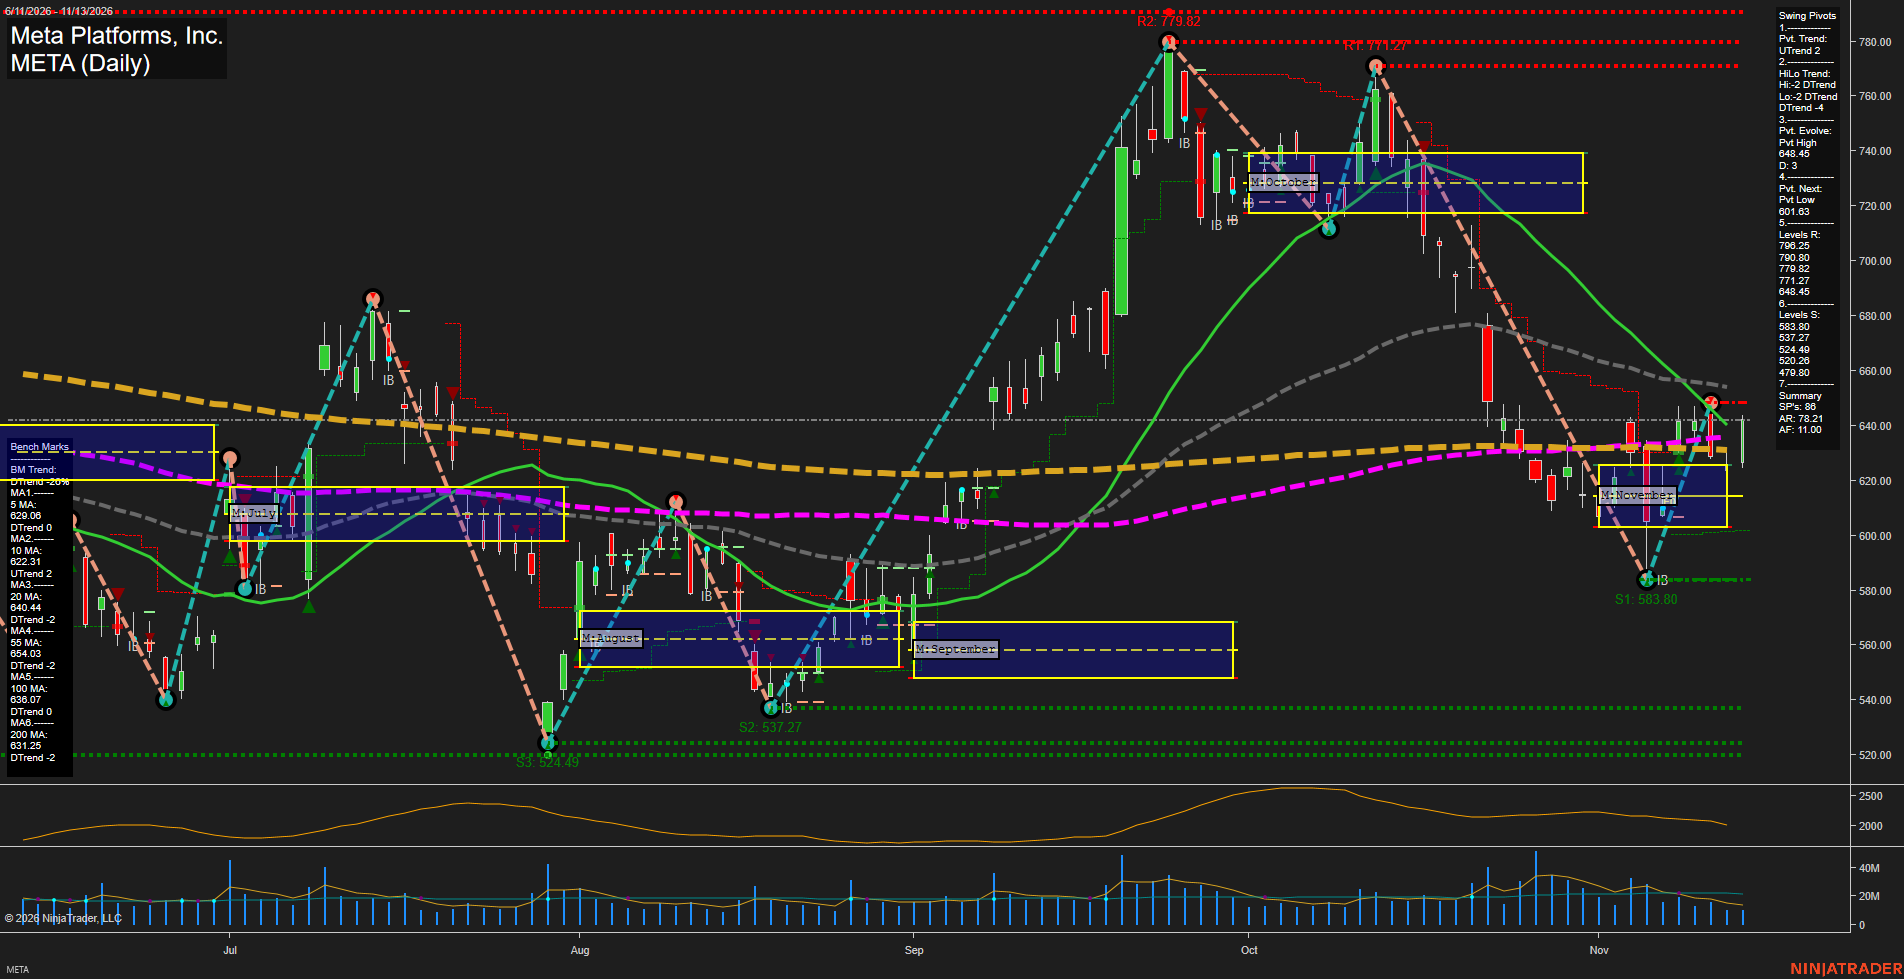
META Meta Platforms; Inc. Daily Chart Analysis — Pre-Open: 2026-Nov-14 07:07 CT
Price Action
- Last: Approximately 642,
- Bars: Medium,
- Mom: Momentum average.
WSFG Weekly
- Near-Term
- WSFG Current: NA%
- F0%/NTZ' Bias: Price Neutral,
- WSFG Trend: Neutral.
MSFG Month Nov
- Medium-Term
- MSFG Current: NA%
- F0%/NTZ' Bias: Price Neutral,
- MSFG Trend: Neutral.
YSFG Year 2026
- Far-Term
- YSFG Current: NA%
- F0%/NTZ' Bias: Price Neutral,
- YSFG Trend: Neutral.
Swing Pivots
- (Near-Term) 1. Pvt. Trend: UTrend,
- (Medium-Term) 2. HiLo Trend: DTrend,
- 3. Pvt. Evolve: Pvt high 648.45,
- 4. Pvt. Next: Pvt low 601.63,
- 5. Levels R: 796.25, 790.80, 779.82, 771.27, 648.45,
- 6. Levels S: 583.80, 537.27, 524.49, 520.26, 479.80.
Daily Benchmarks
- (Near-Term) 5 Day: 629.06 Down Trend,
- (Near-Term) 10 Day: 622.31 Up Trend,
- (Medium-Term) 20 Day: 640.44 Down Trend,
- (Medium-Term) 55 Day: 654.03 Down Trend,
- (Far-Term) 100 Day: 636.07 Down Trend,
- (Far-Term) 200 Day: 631.25 Down Trend.
Additional Metrics
- ATR: 2162,
- VOLMA: 26211336.
Overall Rating
- Near-Term: Bullish,
- Medium-Term: Bearish,
- Far-Term: Bearish.
Key Insights Summary
From a futures swing trader’s perspective, META shows a near-term recovery within a broader declining structure, rather than a confirmed trend reversal. The rebound from 583.80 has lifted price above the November balance area and approximately back above the 20-day benchmark, while the evolving pivot high at 648.45 and falling 55-day benchmark at 654.03 define nearby overhead resistance. The bullish near-term rating reflects the rising pivot trend and 10-day benchmark; the falling 5-day benchmark signals uneven follow-through. Medium-term lower highs and lower lows remain intact, and both longer-term benchmarks still slope downward despite price recovering above them. ATR of 2162 corresponds to approximately $21.62 in daily range, indicating substantial swing amplitude. Recent volume has contracted relative to the preceding selloff, giving the rebound a countertrend character. Weekly and yearly grids and the named strategy-signal readings are not visible, so their direction cannot be independently confirmed. The image does not establish a news catalyst or seasonal influence.
Chart Analysis ATS AI Generated: 2026-11-14 07:07 for Informational use only, not trading advice. Terms and Risk Disclosure Copyright © 2026. Algo Trading Systems LLC.