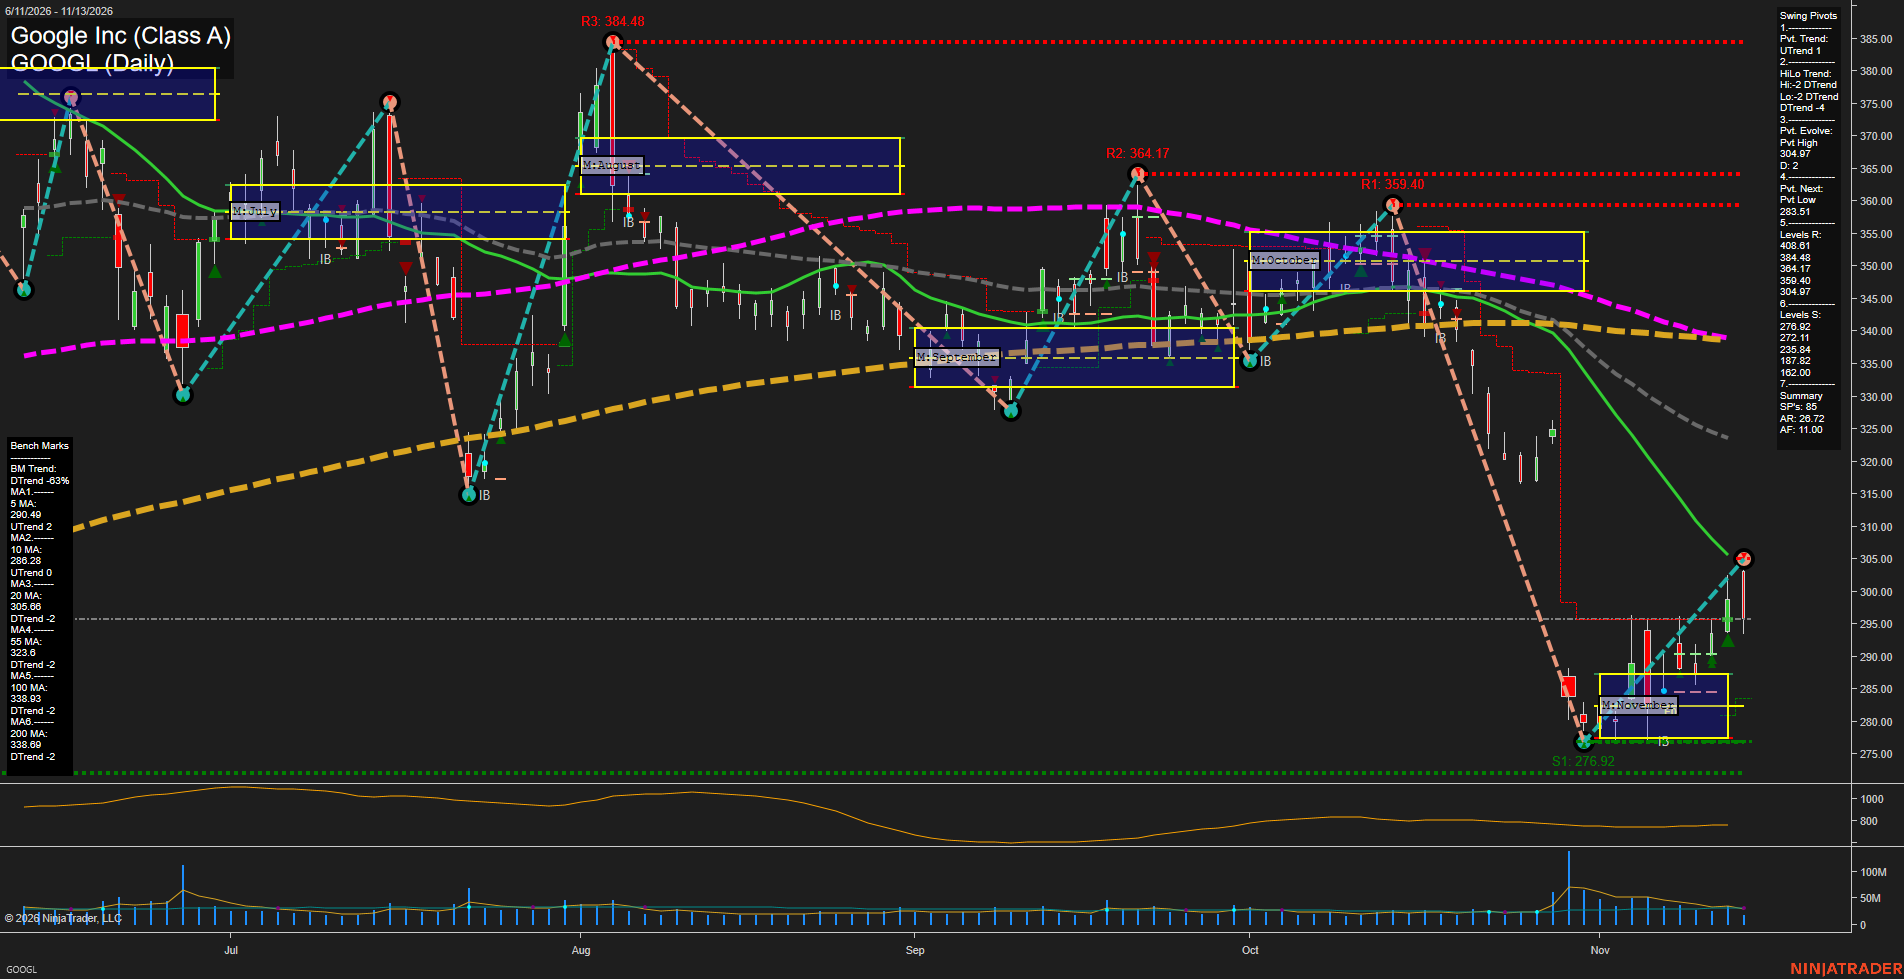
GOOGL Google Inc (Class A) Daily Chart Analysis — Pre-Open: 2026-Nov-14 07:07 CT
Price Action
- Last: Approximately 295.60,
- Bars: Medium,
- Mom: Momentum average.
WSFG Weekly
- Near-Term
- WSFG Current: NA%
- F0%/NTZ' Bias: Price Neutral,
- WSFG Trend: Neutral.
MSFG Month Nov
- Medium-Term
- MSFG Current: NA%
- F0%/NTZ' Bias: Price above NTZ,
- MSFG Trend: Bullish.
YSFG Year 2026
- Far-Term
- YSFG Current: NA%
- F0%/NTZ' Bias: Price Neutral,
- YSFG Trend: Neutral.
Swing Pivots
- (Near-Term) 1. Pvt. Trend: UTrend,
- (Medium-Term) 2. HiLo Trend: DTrend,
- 3. Pvt. Evolve: Pvt high 304.97,
- 4. Pvt. Next: Pvt low 283.51,
- 5. Levels R: 408.61, 384.48, 364.17, 359.40, 304.97,
- 6. Levels S: 276.92, 272.11, 235.84, 187.82, 162.00.
Daily Benchmarks
- (Near-Term) 5 Day: 290.49 Up Trend,
- (Near-Term) 10 Day: 286.28 Up Trend,
- (Medium-Term) 20 Day: 305.66 Down Trend,
- (Medium-Term) 55 Day: 323.60 Down Trend,
- (Far-Term) 100 Day: 338.93 Down Trend,
- (Far-Term) 200 Day: 338.69 Down Trend.
Additional Metrics
- ATR: 420,
- VOLMA: 25379774.
Overall Rating
- Near-Term: Bullish,
- Medium-Term: Bearish,
- Far-Term: Bearish.
Key Insights Summary
From a futures swing trader’s perspective, this equity chart shows a near-term countertrend recovery within a broader bearish structure. The rebound from 276.92 has lifted price above November’s NTZ and both short-term benchmarks, supporting the bullish near-term rating. However, the latest rejection from 304.97 leaves price beneath the declining 20-day benchmark at 305.66, creating a closely aligned resistance area. The medium-term pivot structure remains defined by lower highs and lower lows, while declining 55-, 100- and 200-day benchmarks reinforce the broader downtrend. The 283.51 level is the chart’s next downside pivot-reversal threshold, distinct from established support at 276.92. Volume expanded sharply during the selloff and has generally moderated during the recovery, suggesting less participation in the rebound. Weekly and yearly grids, named trade-signal outputs, and news or seasonal evidence are not available in the image.
Chart Analysis ATS AI Generated: 2026-11-14 07:07 for Informational use only, not trading advice. Terms and Risk Disclosure Copyright © 2026. Algo Trading Systems LLC.