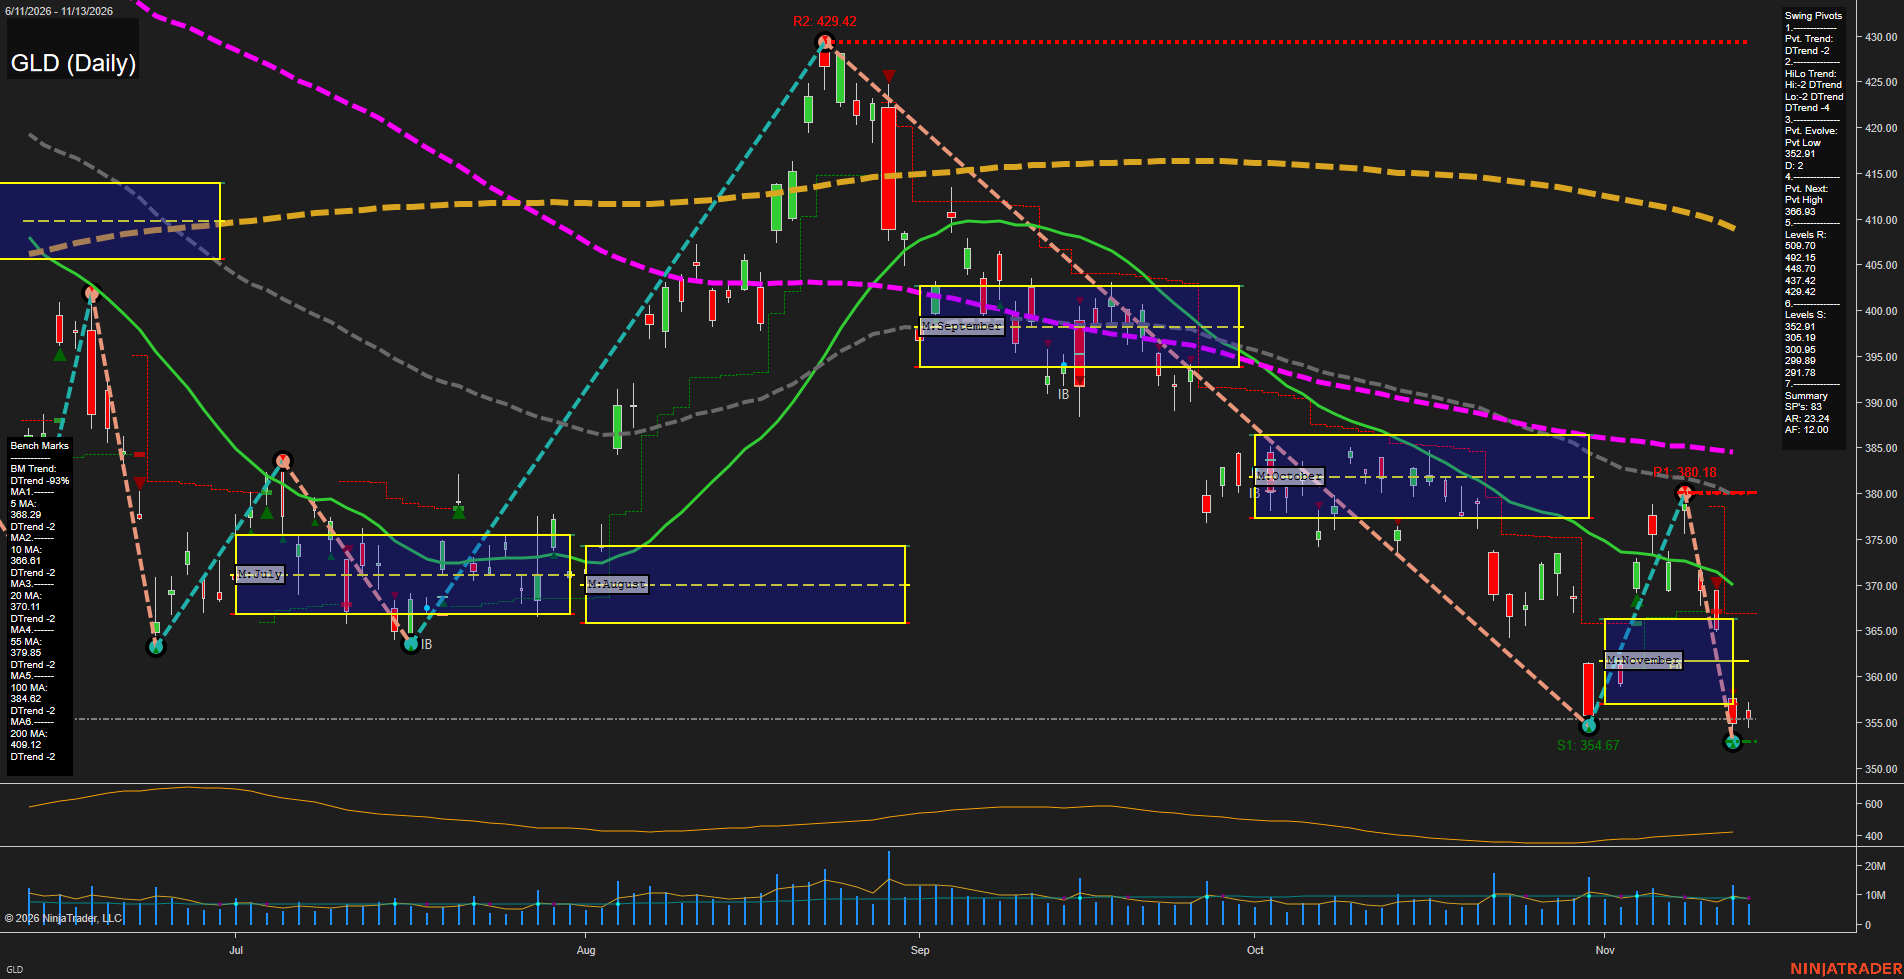
GLD SPDR Gold Shares Daily Chart Analysis — Pre-Open: 2026-Nov-14 07:06 CT
Price Action
- Last: Approximately 355.50,
- Bars: Small,
- Mom: Fast downside momentum followed by a small stabilization bar.
WSFG Weekly
- Near-Term
- WSFG Current: NA%
- F0%/NTZ' Bias: Price Neutral, weekly grid not displayed,
- WSFG Trend: Neutral.
MSFG Month Nov
- Medium-Term
- MSFG Current: NA%
- F0%/NTZ' Bias: Price below F0% and NTZ Lower,
- MSFG Trend: Bearish.
YSFG Year 2026
- Far-Term
- YSFG Current: NA%
- F0%/NTZ' Bias: Price Neutral, yearly grid not displayed,
- YSFG Trend: Neutral.
Swing Pivots
- (Near-Term) 1. Pvt. Trend: DTrend,
- (Medium-Term) 2. HiLo Trend: DTrend,
- 3. Pvt. Evolve: Pvt low 352.91,
- 4. Pvt. Next: Pvt high 366.93,
- 5. Levels R: 509.70, 492.15, 448.70, 437.42, 429.42,
- 6. Levels S: 352.91, 305.19, 300.85, 299.89, 291.78.
Daily Benchmarks
- (Near-Term) 5 Day: 368.29 Down Trend,
- (Near-Term) 10 Day: 366.61 Down Trend,
- (Medium-Term) 20 Day: 370.11 Down Trend,
- (Medium-Term) 55 Day: 379.85 Down Trend,
- (Far-Term) 100 Day: 384.62 Down Trend,
- (Far-Term) 200 Day: 409.12 Down Trend.
Additional Metrics
- ATR: 159,
- VOLMA: 7207880.
Overall Rating
- Near-Term: Bearish,
- Medium-Term: Bearish,
- Far-Term: Bearish.
Key Insights Summary
From a futures swing trader’s perspective, GLD reflects a broad gold-market downswing rather than an established bullish reversal; its prices are ETF levels, not gold futures quotes. The rebound from 354.67 to 380.18 failed, followed by a lower low at 352.91. Price is below all six declining benchmarks and beneath November’s monthly neutral zone, approximately 357–366, reinforcing bearish alignment across time horizons. The latest small candle shows a pause near the lows, not confirmation of a durable bottom. The chart’s formal resistance summary lists older overhead pivots; the recent 380.18 swing high and 366.93 next-pivot threshold provide nearer structural reference points. Weekly and yearly grids and the named trade-signal series are not displayed, so their direction cannot be independently established. No news or seasonal catalyst is identifiable from this chart alone.
Chart Analysis ATS AI Generated: 2026-11-14 07:07 for Informational use only, not trading advice. Terms and Risk Disclosure Copyright © 2026. Algo Trading Systems LLC.