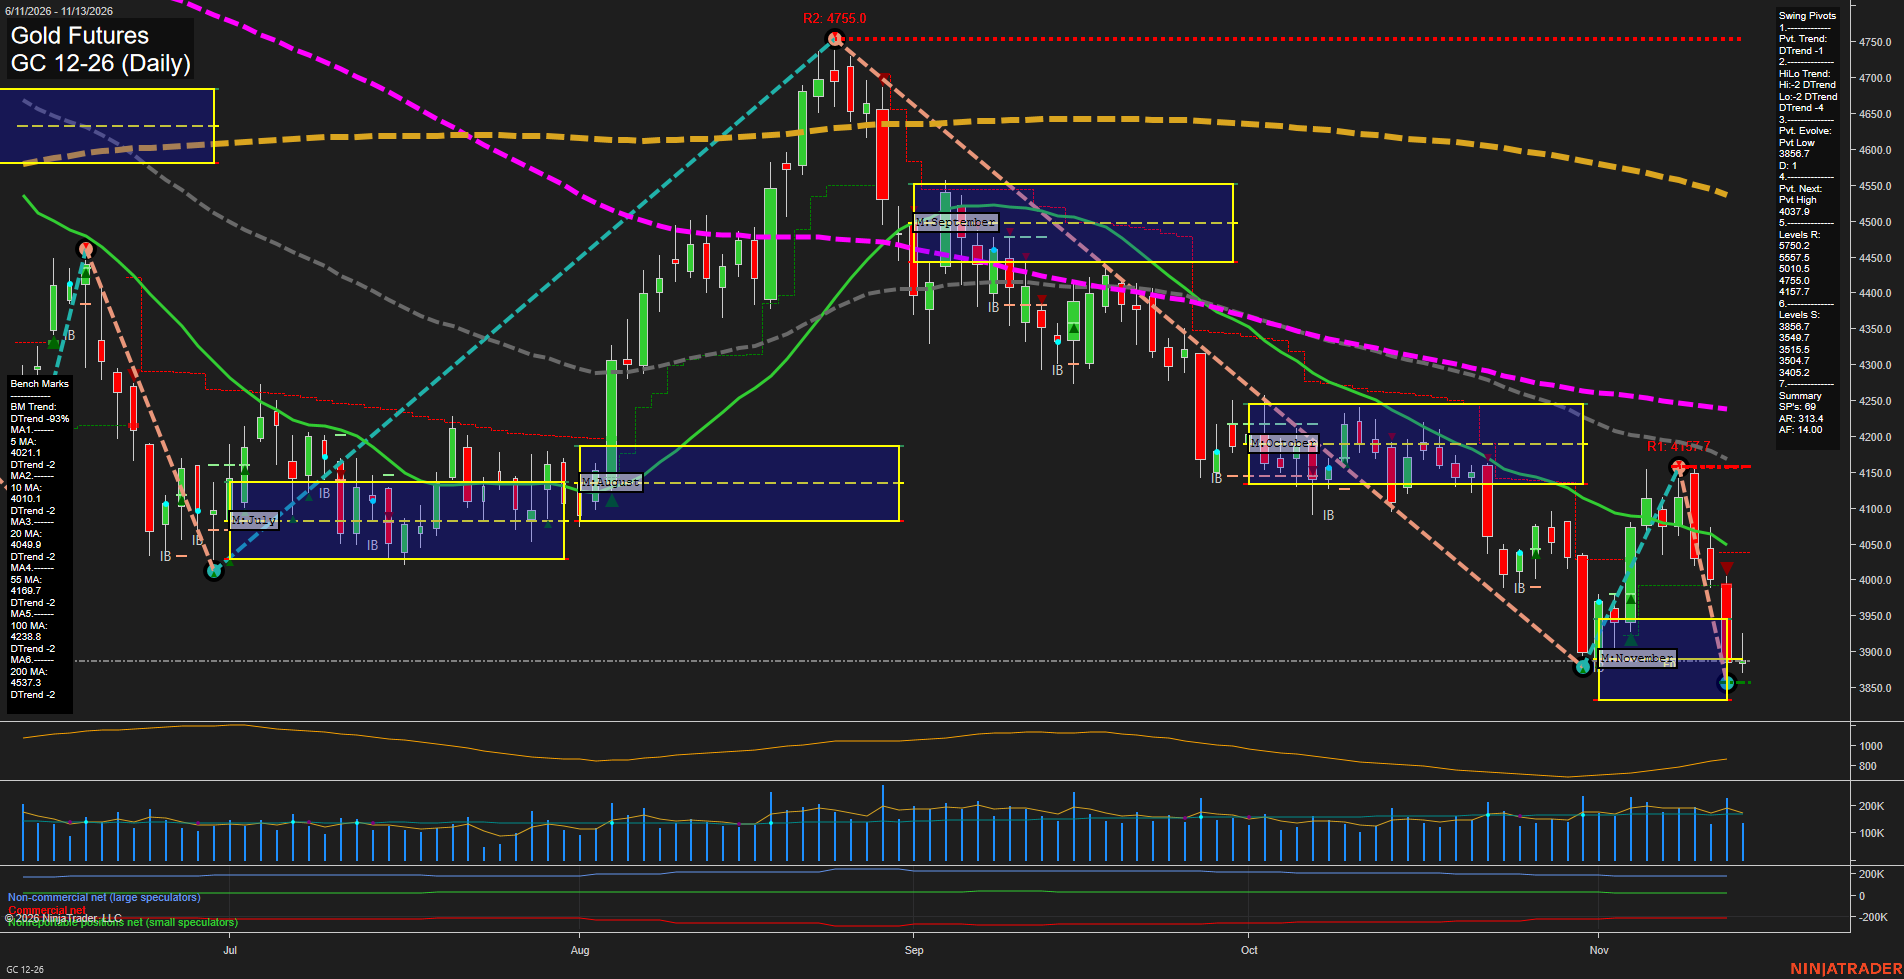
GC Gold Futures Daily Chart Analysis — Pre-Open: 2026-Nov-14 07:06 CT
Price Action
- Last: Approximately 3888,
- Bars: Large,
- Mom: Momentum fast.
WSFG Weekly
- Near-Term
- WSFG Current: -89%
- F0%/NTZ' Bias: Price Below,
- WSFG Trend: Down.
MSFG Month Nov
- Medium-Term
- MSFG Current: -1%
- F0%/NTZ' Bias: Price Below,
- MSFG Trend: Down.
YSFG Year 2026
- Far-Term
- YSFG Current: -169%
- F0%/NTZ' Bias: Price Below,
- YSFG Trend: Down.
Swing Pivots
- (Near-Term) 1. Pvt. Trend: DTrend,
- (Medium-Term) 2. HiLo Trend: DTrend,
- 3. Pvt. Evolve: Pvt low 3856.7,
- 4. Pvt. Next: Pvt high 4037.9,
- 5. Levels R: 5750.2, 5557.5, 5010.5, 4755.0, 4157.7,
- 6. Levels S: 3856.7, 3549.7, 3515.5, 3504.7, 3405.2.
Daily Benchmarks
- (Near-Term) 5 Day: 4021.1 Down Trend,
- (Near-Term) 10 Day: 4010.1 Down Trend,
- (Medium-Term) 20 Day: 4049.9 Down Trend,
- (Medium-Term) 55 Day: 4169.7 Down Trend,
- (Far-Term) 100 Day: 4238.8 Down Trend,
- (Far-Term) 200 Day: 4537.3 Down Trend.
Additional Metrics
Recent Trade Signals
- 12 Nov 2026: Short GC 12-26 @ 3883.5 Signals.USAR.TR720
- 11 Nov 2026: Short GC 12-26 @ 4052.6 Signals.USAR-WSFG
- 10 Nov 2026: Short GC 12-26 @ 4030.1 Signals.USAR.TR120
Overall Rating
- Near-Term: Bearish,
- Medium-Term: Bearish,
- Far-Term: Bearish.
Key Insights Summary
Gold shows a bearish swing structure across all three horizons. The rebound to 4157.7 failed below the preceding major swing high, followed by renewed selling and an evolving lower low at 3856.7. Price remains below all six declining benchmarks, while weekly, monthly and yearly grid readings reinforce the downside alignment. Recent large bearish bars indicate fast downside momentum, although the latest small bar near 3888 shows a pause near support rather than a confirmed reversal. The 4037.9 next-pivot threshold and 4157.7 swing resistance define overhead structural reference points; 3856.7 is the nearest listed support. Recent short signals corroborate the bearish trend across near-term and far-term measures. Overall, the chart depicts a failed countertrend rally followed by downside continuation; it does not independently establish a news or seasonal explanation.
Chart Analysis ATS AI Generated: 2026-11-14 07:06 for Informational use only, not trading advice. Terms and Risk Disclosure Copyright © 2026. Algo Trading Systems LLC.