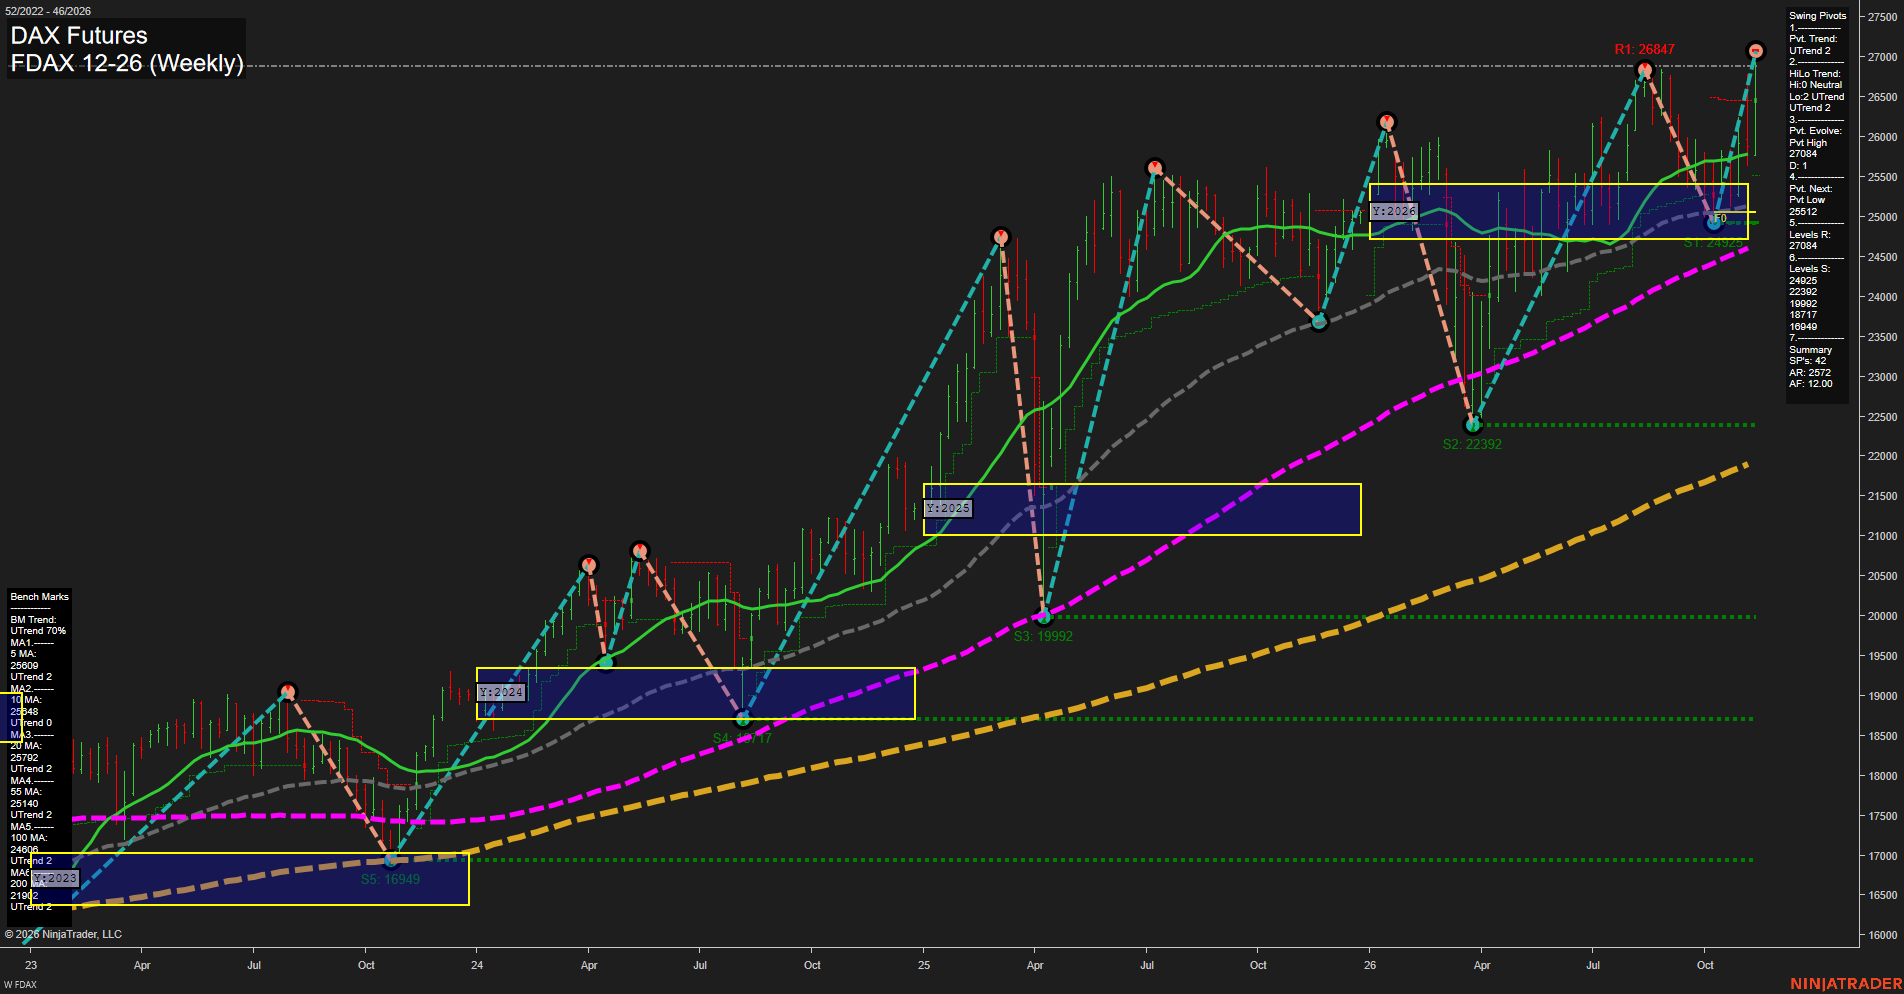
FDAX DAX Futures Weekly Chart Analysis — Pre-Open: 2026-Nov-14 07:05 CT
Price Action
- Last: Approximately 26900,
- Bars: Large,
- Mom: Momentum fast.
WSFG Weekly
- Near-Term
- WSFG Current: 129%
- F0%/NTZ' Bias: Price Above,
- WSFG Trend: Up.
MSFG Month Nov
- Medium-Term
- MSFG Current: 78%
- F0%/NTZ' Bias: Price Above,
- MSFG Trend: Up.
YSFG Year 2026
- Far-Term
- YSFG Current: 52%
- F0%/NTZ' Bias: Price Above,
- YSFG Trend: Up.
Swing Pivots
- (Near-Term) 1. Pvt. Trend: UTrend,
- (Medium-Term) 2. HiLo Trend: UTrend,
- 3. Pvt. Evolve: Pvt high 27084,
- 4. Pvt. Next: Pvt low 25512,
- 5. Levels R: 27084,
- 6. Levels S: 24925, 22392, 19992, 18717, 16949.
Weekly Benchmarks
- (Near-Term) 5 Week: 25609 Up Trend,
- (Near-Term) 10 Week: 25348 Up Trend,
- (Medium-Term) 20 Week: 25792 Up Trend,
- (Medium-Term) 55 Week: 25140 Up Trend,
- (Far-Term) 100 Week: 24606 Up Trend,
- (Far-Term) 200 Week: 21912 Up Trend.
Recent Trade Signals
- 06 Nov 2026: Short FDAX 12-26 @ 25803 Signals.USAR-MSFG
- 06 Nov 2026: Short FDAX 12-26 @ 25803 Signals.USAR-WSFG
Overall Rating
- Near-Term: Bullish,
- Medium-Term: Bullish,
- Far-Term: Bullish.
Key Insights Summary
The weekly chart shows a sharp recovery from the 24925 swing low into a developing 27084 pivot high, extending beyond the previous 26847 peak. Price remains above all six rising benchmarks and the yearly neutral zone, supporting bullish trend alignment across time horizons. The medium-term pivot summary combines neutral highs with rising lows, indicating stronger support progression than fully established higher-high confirmation. The 25512 pivot-reversal threshold is distinct from confirmed support at 24925. The November 6 short signals conflict with the subsequent upward price expansion and remain countertrend relative to the displayed grids and benchmarks. Broad weekly ranges indicate elevated volatility despite the bullish structure. No TR120 or TR720 signals, news catalysts, or seasonal evidence are provided in the chart.
Chart Analysis ATS AI Generated: 2026-11-14 07:05 for Informational use only, not trading advice. Terms and Risk Disclosure Copyright © 2026. Algo Trading Systems LLC.